DocumentsAppendixJun 8, 2020Pages 48–83
Appendix: 2019 Statement of Financial Information (SOFI) — City of Langford
Complete 2019 SOFI package including schedules (debts, guarantees, grants, remuneration, council indemnities), schedule of payments to suppliers, and audited consolidated financial statements for the year ended December 31, 2019.
Key facts
- Schedule of Employee Remuneration: total reported remuneration $9,583,064.92; total (including <75k) reached higher aggregated totals
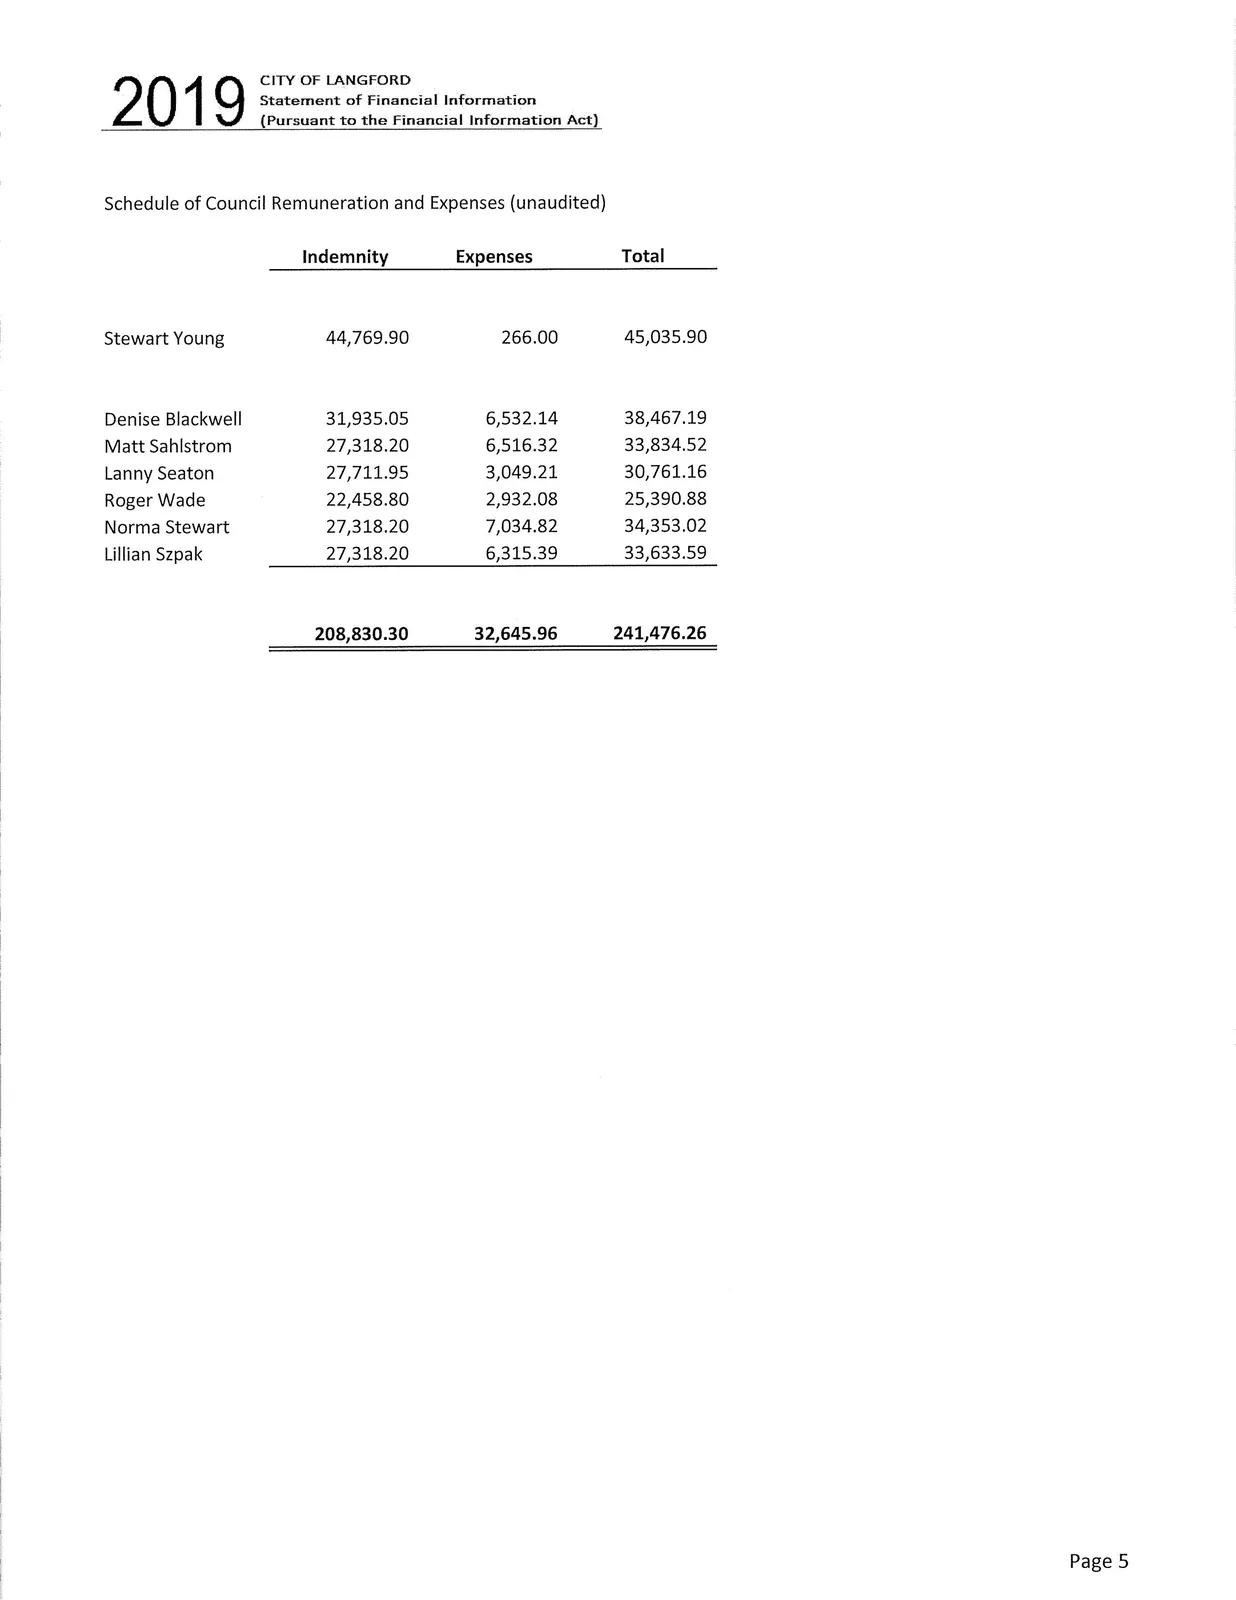
- Schedule of Council Remuneration and Expenses: total indemnities and expenses $241,476.26
- Schedule of Payments to Suppliers: vendor totals over $25,000 equal $106,345,212.46; total payments listed $109,485,242.97
- GIC Purchases: $14,000,000.00 (investment noted)
- Consolidated Financial Statements included for year ended Dec 31, 2019 (audited by KPMG)
Appendix: 2019 Statement of Financial Information (SOFI) — City of Langford
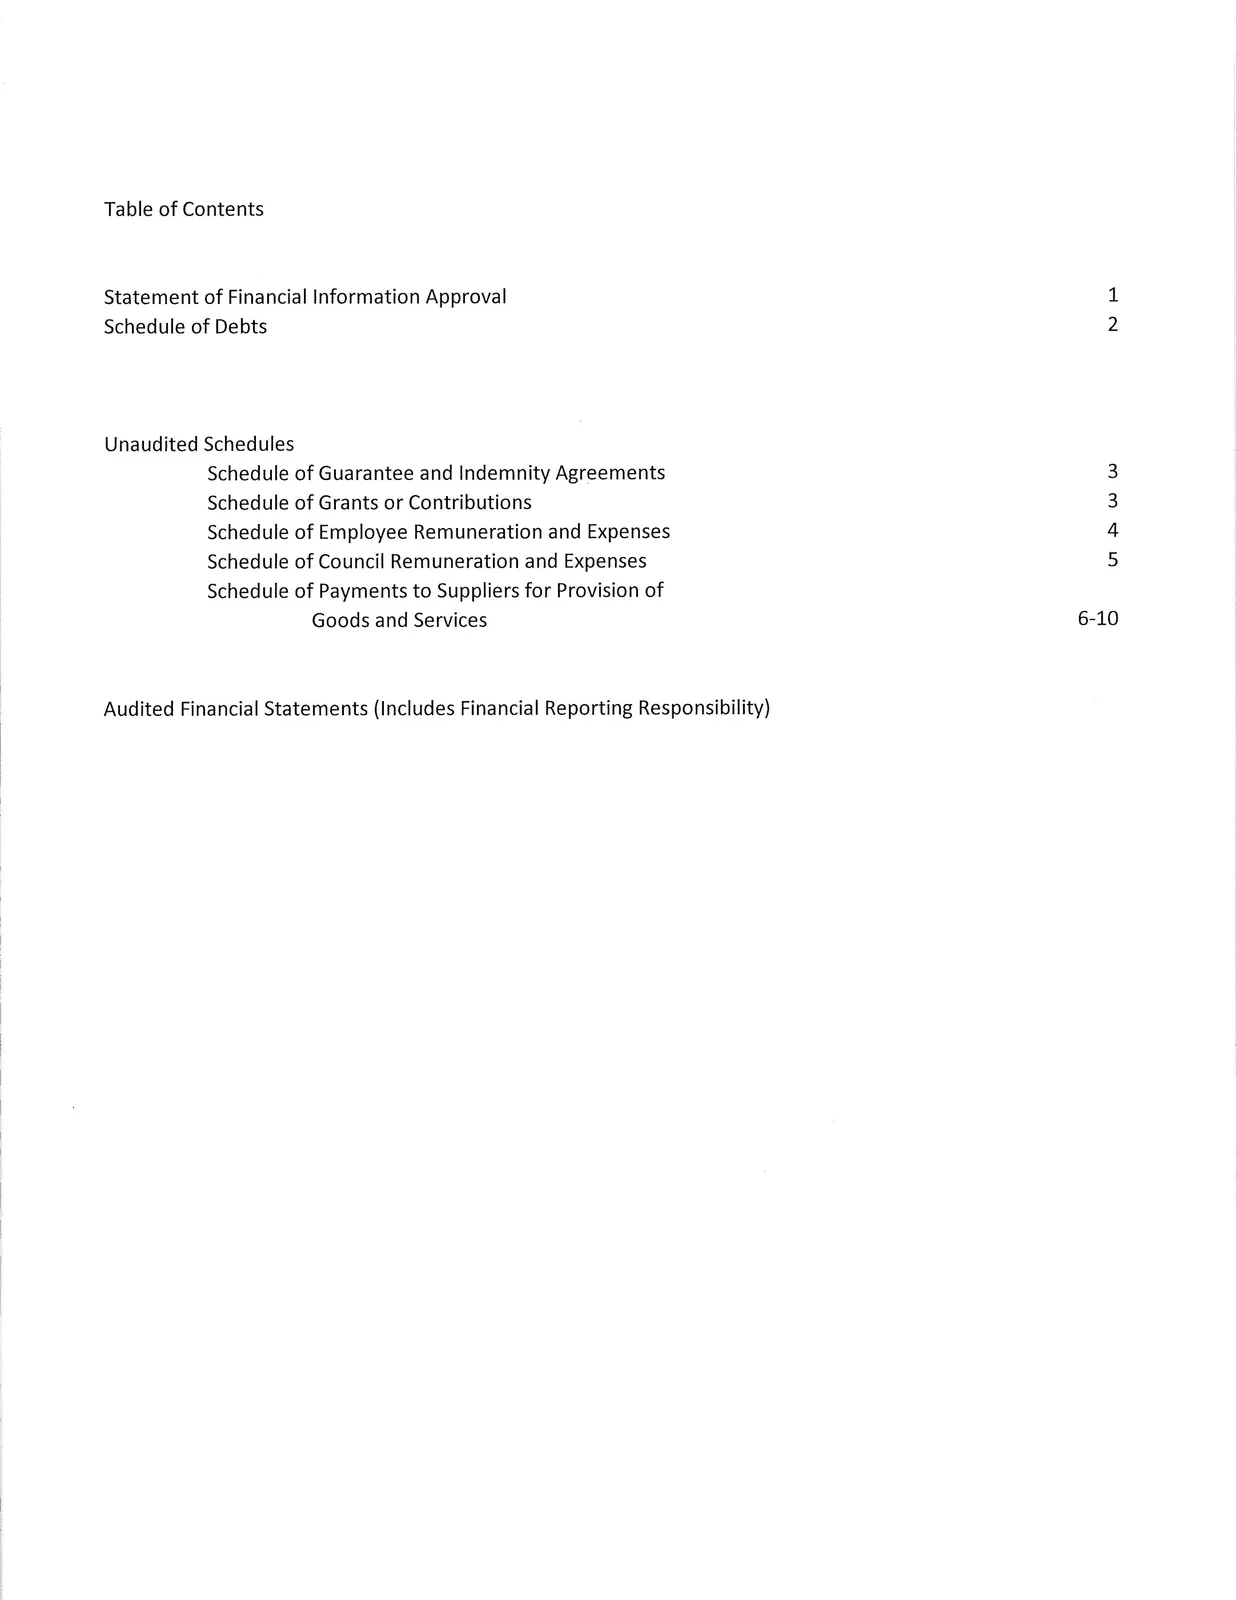
Table of Contents
- Statement of Financial Information Approval
- Schedule of Debts
- Schedule of Guarantee and Indemnity Agreements (Unaudited)
- Schedule of Grants or Contributions (Unaudited)
- Schedule of Employee Remuneration and Expenses (Unaudited)
- Schedule of Council Remuneration and Expenses (Unaudited)
- Schedule of Payments to Suppliers for Provision of Goods and Services
- Audited Financial Statements (Includes Financial Reporting Responsibility)
Statement of Financial Information Approval
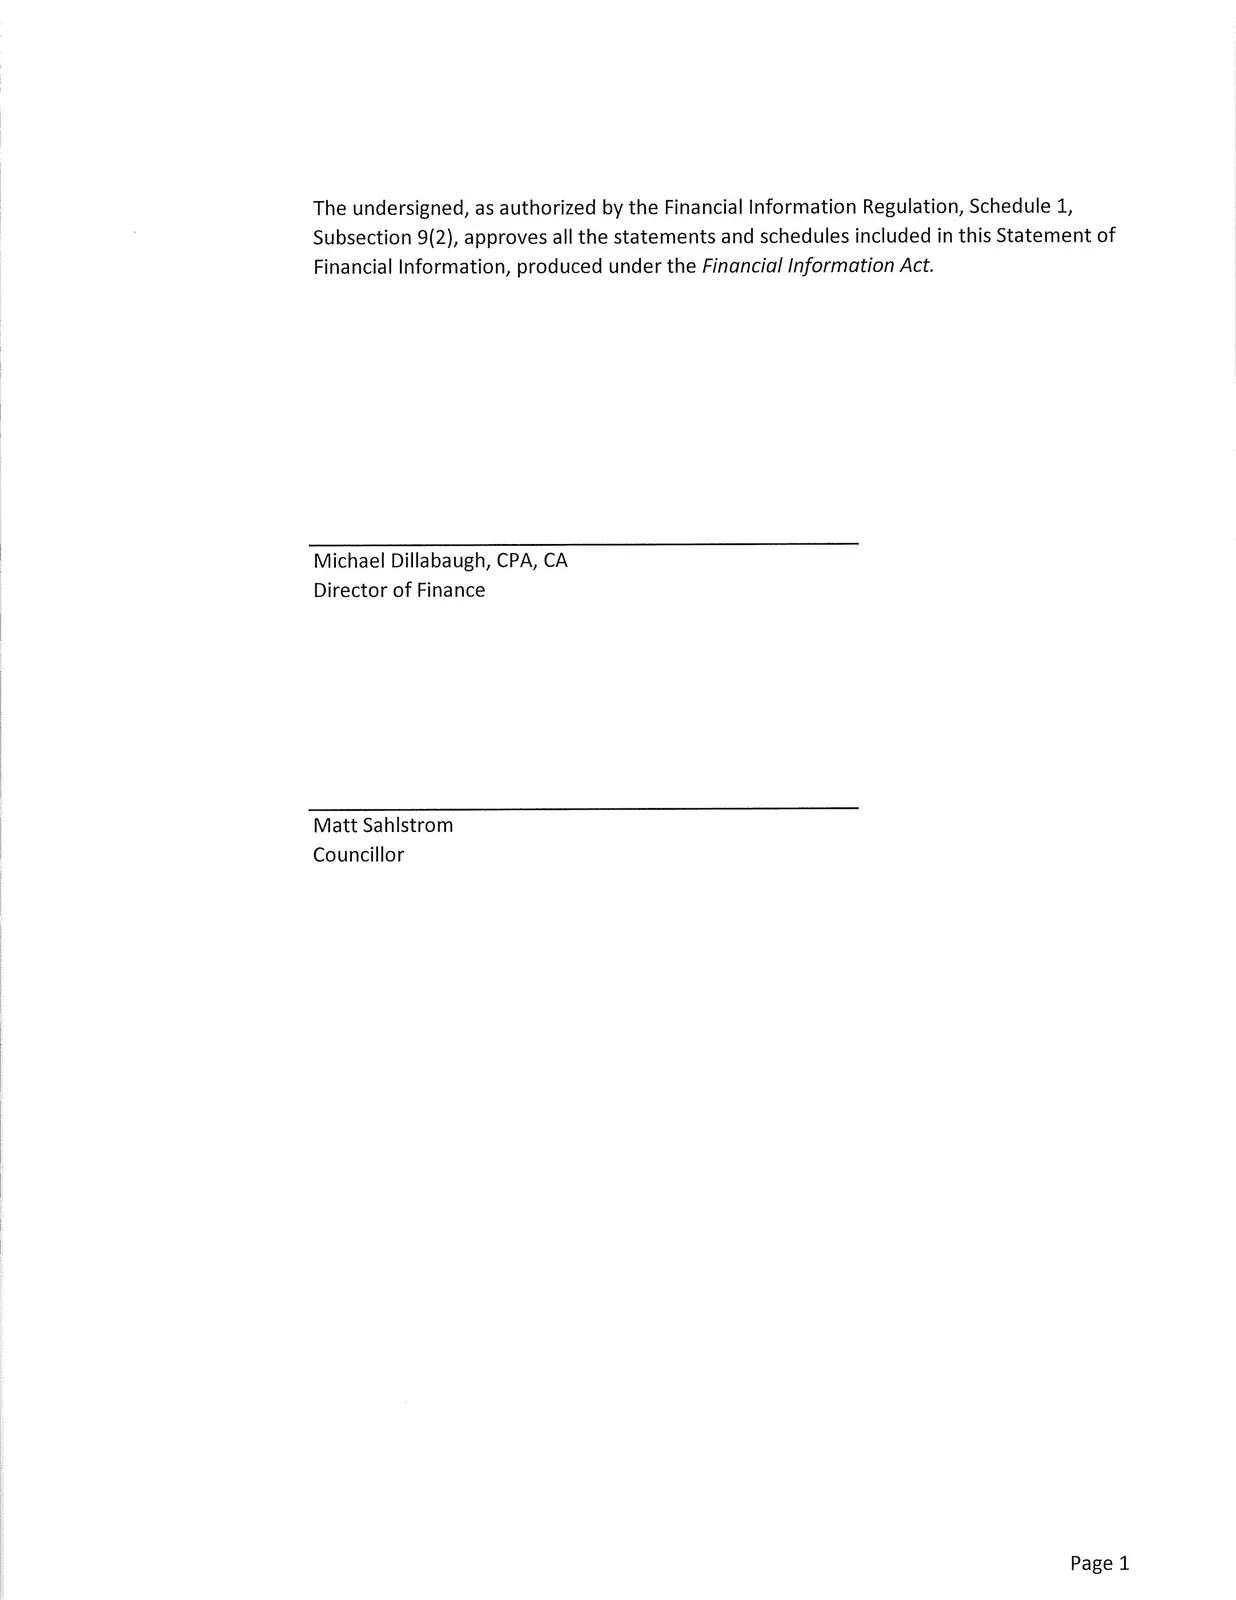
The undersigned, as authorized by the Financial Information Regulation, Schedule 1, Subsection 9(2), approves all the statements and schedules included in this Statement of Financial Information, produced under the Financial Information Act.
Michael Dillabaugh, CPA, CA
Director of Finance
Matt Sahlstronn
Councillor
Schedule of Debts
Information on all long term debts for this organization is included in Note 4 to the 2019 Audited Financial Statements.
Schedule of Guarantee and Indemnity Agreements (Unaudited)
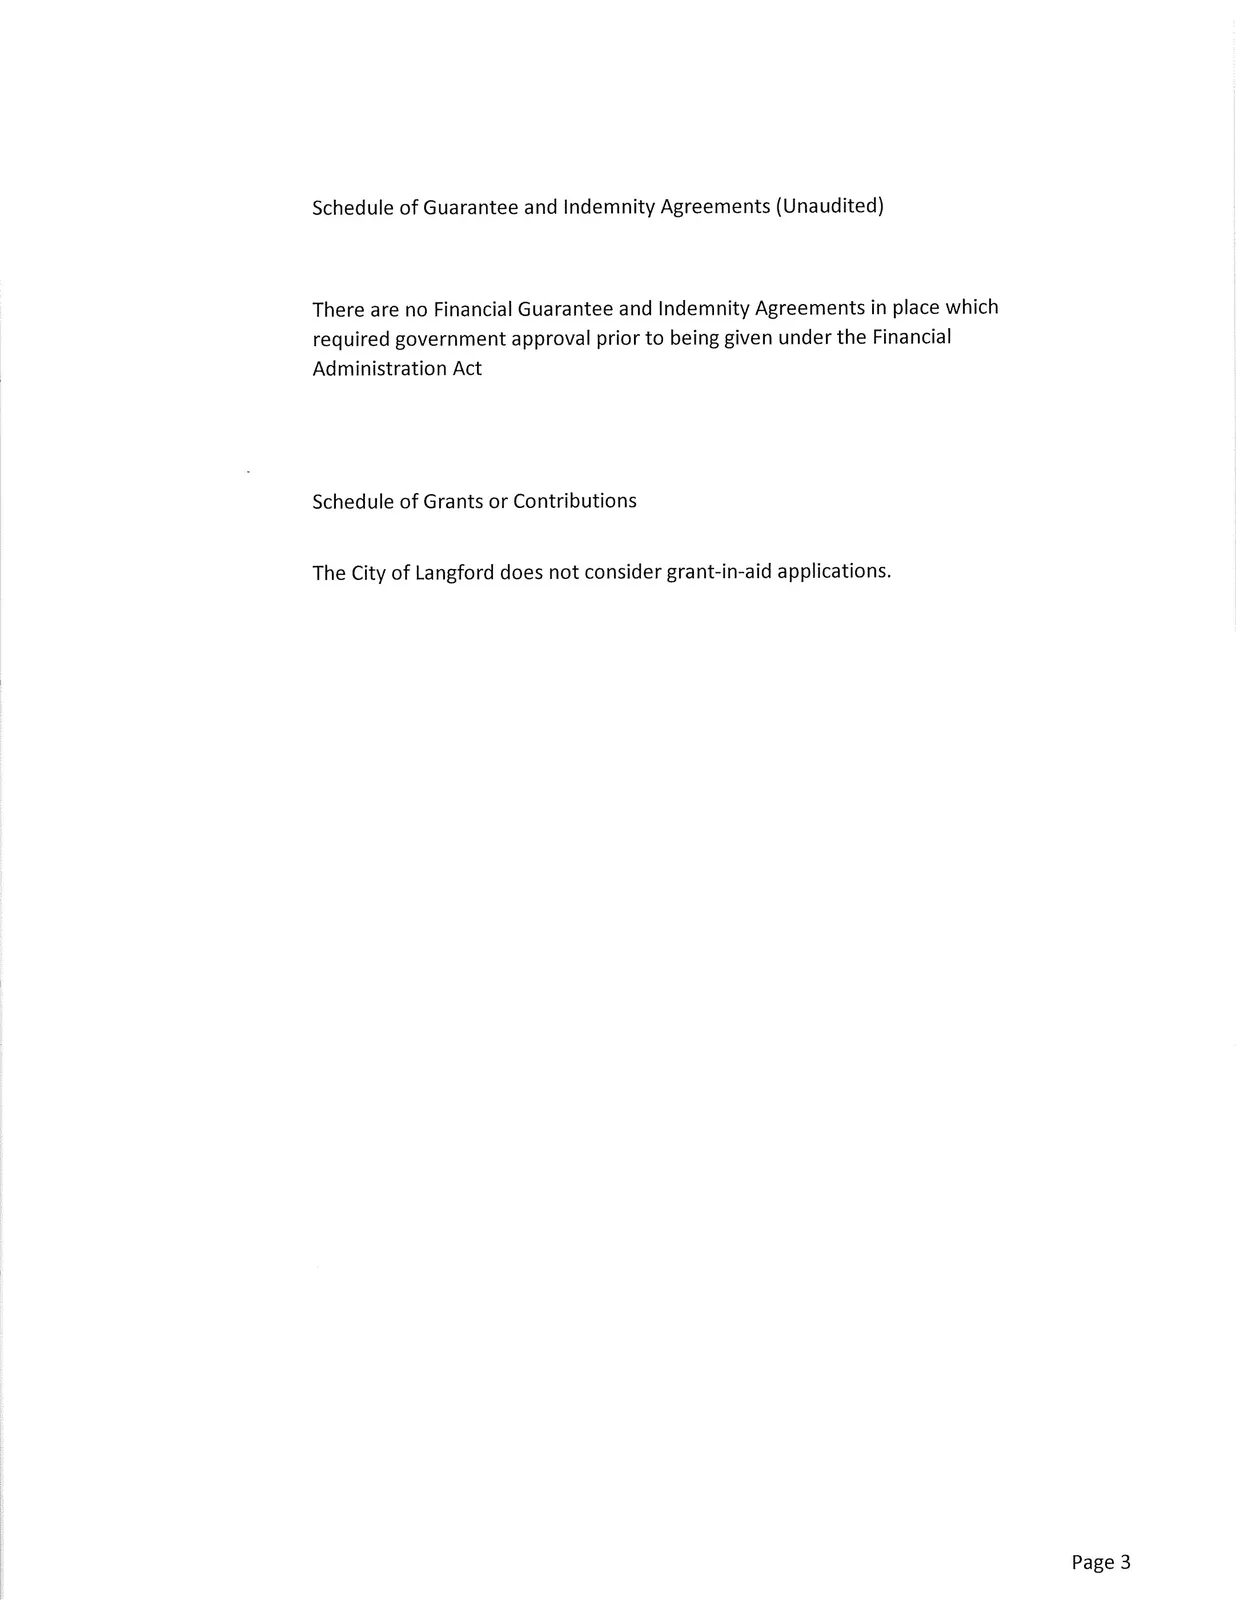
There are no Financial Guarantee and Indemnity Agreements in place which required government approval prior to being given under the Financial Administration Act.
Schedule of Grants or Contributions (Unaudited)
The City of Langford does not consider grant-in-aid applications.
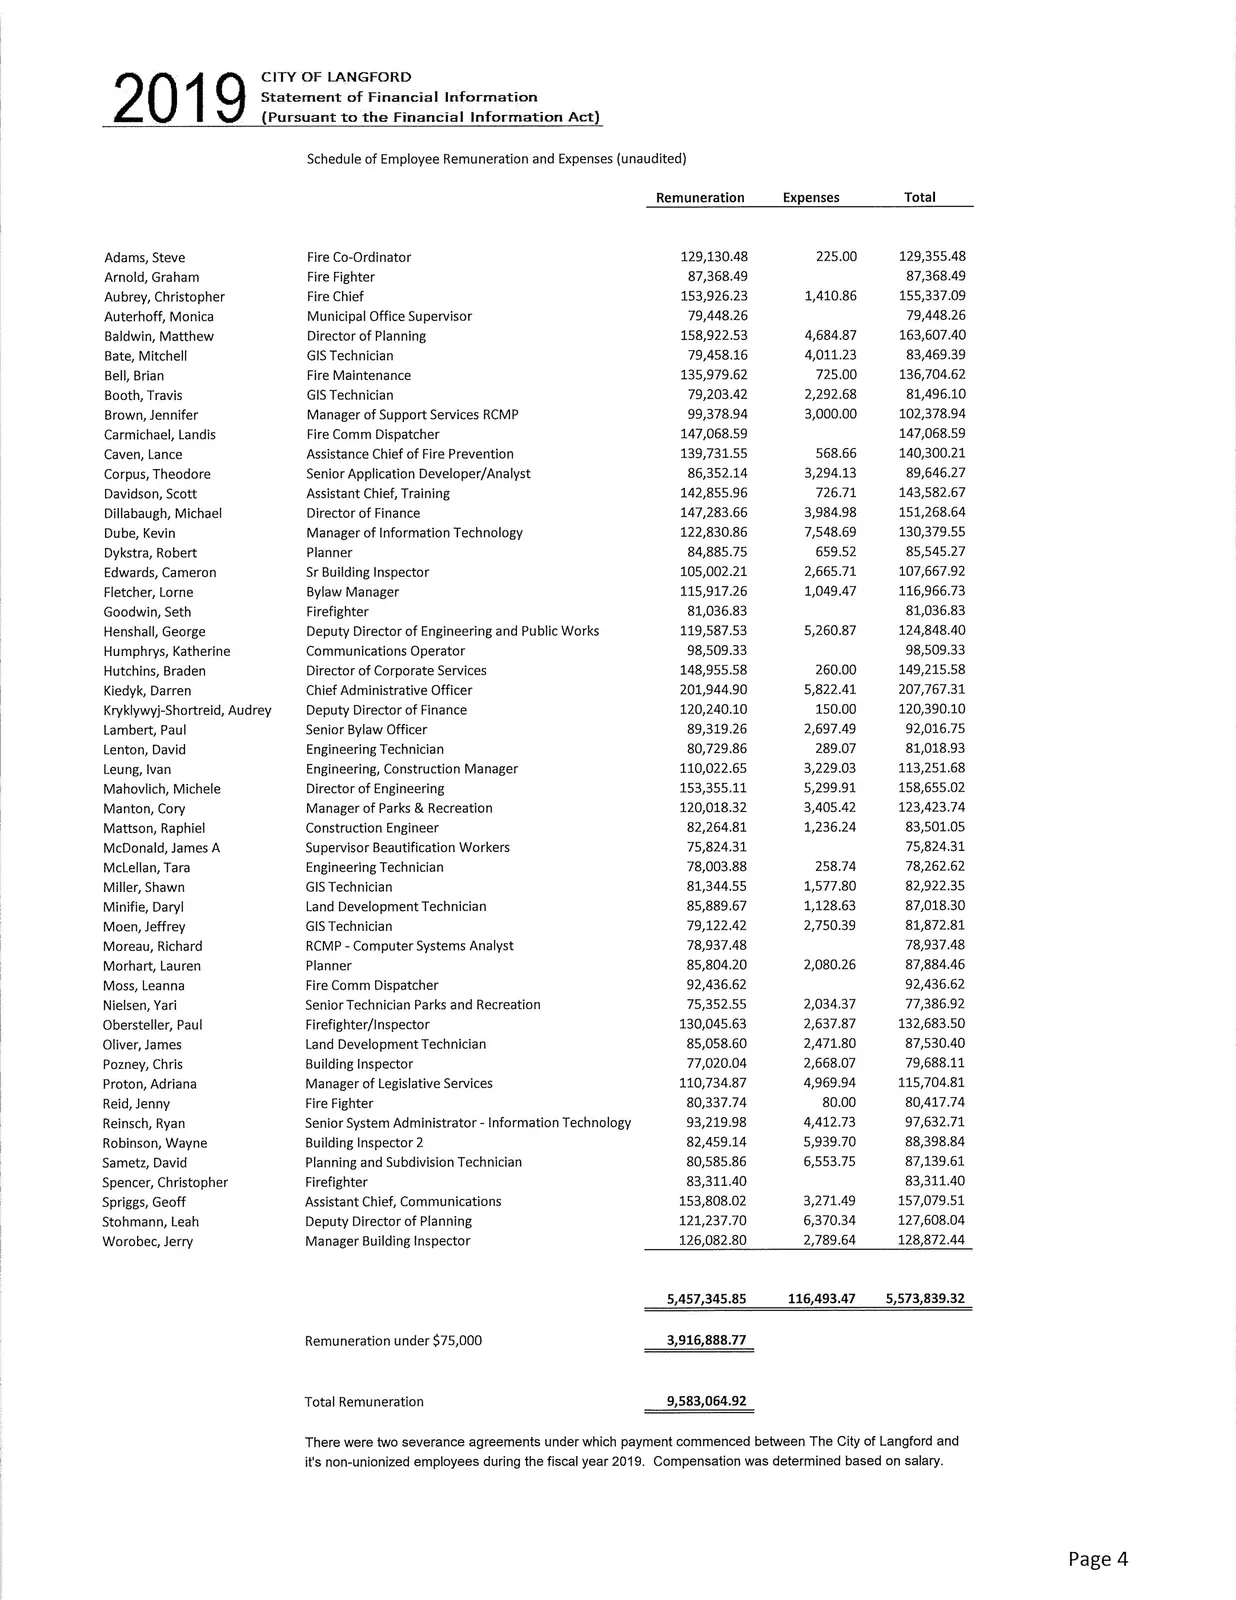
Schedule of Employee Remuneration and Expenses (Unaudited)
Remuneration and expenses for named employees for fiscal year 2019:
| Name | Position | Remuneration | Expenses | Total |
|---|---|---|---|---|
| Adams, Steve | Fire Co-Ordinator | 129,130.48 | 225.00 | 129,355.48 |
| Arnold, Graham | Fire Fighter | 87,368.49 | 87,368.49 | |
| Aubrey, Christopher | Fire Chief | 153,926.23 | 1,410.86 | 155,337.09 |
| Auterhoff, Monica | Municipal Office Supervisor | 79,448.26 | 79,448.26 | |
| Baldwin, Matthew | Director of Planning | 158,922.53 | 4,684.87 | 163,607.40 |
| Bate, Mitchell | GIS Technician | 79,458.16 | 4,011.23 | 83,469.39 |
| Bell, Brian | Fire Maintenance | 135,979.62 | 725.00 | 136,704.62 |
| Booth, Travis | GIS Technician | 79,203.42 | 2,292.68 | 81,496.10 |
| Brown, Jennifer | Manager of Support Services RCMP | 99,378.94 | 3,000.00 | 102,378.94 |
| Carmichael, Landis | Fire Comm Dispatcher | 147,068.59 | 147,068.59 | |
| Caven, Lance | Assistance Chief of Fire Prevention | 139,731.55 | 568.66 | 140,300.21 |
| Corpus, Theodore | Senior Application Developer/Analyst | 86,352.14 | 3,294.13 | 89,646.27 |
| Davidson, Scott | Assistant Chief, Training | 142,855.96 | 726.71 | 143,582.67 |
| Dillabaugh, Michael | Director of Finance | 147,283.66 | 3,984.98 | 151,268.64 |
| Dube, Kevin | Manager of Information Technology | 122,830.86 | 7,548.69 | 130,379.55 |
| Dykstra, Robert | Planner | 84,885.75 | 659.52 | 85,545.27 |
| Edwards, Cameron | Sr Building Inspector | 105,002.21 | 2,665.71 | 107,667.92 |
| Fletcher, Lorne | Bylaw Manager | 115,917.26 | 1,049.47 | 116,966.73 |
| Goodwin, Seth | Firefighter | 81,036.83 | 81,036.83 | |
| Henshall, George | Deputy Director of Engineering and Public Works | 119,587.53 | 5,260.87 | 124,848.40 |
| Humphrys, Katherine | Communications Operator | 98,509.33 | 98,509.33 | |
| Hutchins, Braden | Director of Corporate Services | 148,955.58 | 260.00 | 149,215.58 |
| Kiedyk, Darren | Chief Administrative Officer | 201,944.90 | 5,822.41 | 207,767.31 |
| Kryklywyj-Shortreid, Audrey | Deputy Director of Finance | 120,240.10 | 150.00 | 120,390.10 |
| Lambert, Paul | Senior Bylaw Officer | 89,319.26 | 2,697.49 | 92,016.75 |
| Lenton, David | Engineering Technician | 80,729.86 | 289.07 | 81,018.93 |
| Leung, Ivan | Engineering, Construction Manager | 110,022.65 | 3,229.03 | 113,251.68 |
| Mahovlich, Michele | Director of Engineering | 153,355.11 | 5,299.91 | 158,655.02 |
| Manton, Cory | Manager of Parks & Recreation | 120,018.32 | 3,405.42 | 123,423.74 |
| Mattson, Raphiel | Construction Engineer | 82,264.81 | 1,236.24 | 83,501.05 |
| McDonald, James A | Supervisor Beautification Workers | 75,824.31 | 75,824.31 | |
| McLellan, Tara | Engineering Technician | 78,003.88 | 258.74 | 78,262.62 |
| Miller, Shawn | GIS Technician | 81,344.55 | 1,577.80 | 82,922.35 |
| Minifie, Daryl | Land Development Technician | 85,889.67 | 1,128.63 | 87,018.30 |
| Moen, Jeffrey | GIS Technician | 79,122.42 | 2,750.39 | 81,872.81 |
| Moreau, Richard | RCMP - Computer Systems Analyst | 78,937.48 | 78,937.48 | |
| Morhart, Lauren | Planner | 85,804.20 | 2,080.26 | 87,884.46 |
| Moss, Leanna | Fire Comm Dispatcher | 92,436.62 | 92,436.62 | |
| Nielsen, Yari | Senior Technician Parks and Recreation | 75,352.55 | 2,034.37 | 77,386.92 |
| Obersteller, Paul | Firefighter/Inspector | 130,045.63 | 2,637.87 | 132,683.50 |
| Oliver, James | Land Development Technician | 85,058.60 | 2,471.80 | 87,530.40 |
| Pozney, Chris | Building Inspector | 77,020.04 | 2,668.07 | 79,688.11 |
| Proton, Adriana | Manager of Legislative Services | 110,734.87 | 4,969.94 | 115,704.81 |
| Reid, Jenny | Fire Fighter | 80,337.74 | 80.00 | 80,417.74 |
| Reinsch, Ryan | Senior System Administrator - Information Technology | 93,219.98 | 4,412.73 | 97,632.71 |
| Robinson, Wayne | Building Inspector 2 | 82,459.14 | 5,939.70 | 88,398.84 |
| Sametz, David | Planning and Subdivision Technician | 80,585.86 | 6,553.75 | 87,139.61 |
| Spencer, Christopher | Firefighter | 83,311.40 | 83,311.40 | |
| Spriggs, Geoff | Assistant Chief, Communications | 153,808.02 | 3,271.49 | 157,079.51 |
| Stohmann, Leah | Deputy Director of Planning | 121,237.70 | 6,370.34 | 127,608.04 |
| Worobec, Jerry | Manager Building Inspector | 126,082.80 | 2,789.64 | 128,872.44 |
Totals and summary:
- Total listed remuneration: 5,457,345.85
- Total listed expenses: 116,493.47
- Total listed (those shown above): 5,573,839.32
- Remuneration under $75,000: 3,916,888.77
- Total Remuneration (all employees): 9,583,064.92
There were two severance agreements under which payment commenced between The City of Langford and it's non-unionized employees during the fiscal year 2019. Compensation was determined based on salary.
Schedule of Council Remuneration and Expenses (Unaudited)
Council indemnity, expenses and totals for 2019:
| Councillor | Indemnity | Expenses | Total |
|---|---|---|---|
| Stewart Young | 44,769.90 | 266.00 | 45,035.90 |
| Denise Blackwell | 31,935.05 | 6,532.14 | 38,467.19 |
| Matt Sahlstrom | 27,318.20 | 6,516.32 | 33,834.52 |
| Lanny Seaton | 27,711.95 | 3,049.21 | 30,761.16 |
| Roger Wade | 22,458.80 | 2,932.08 | 25,390.88 |
| Norma Stewart | 27,318.20 | 7,034.82 | 34,353.02 |
| Lillian Szpak | 27,318.20 | 6,315.39 | 33,633.59 |
- Total Indemnity: 208,830.30
- Total Expenses: 32,645.96
- Total: 241,476.26
Schedule of Payments to Suppliers for Provision of Goods and Services

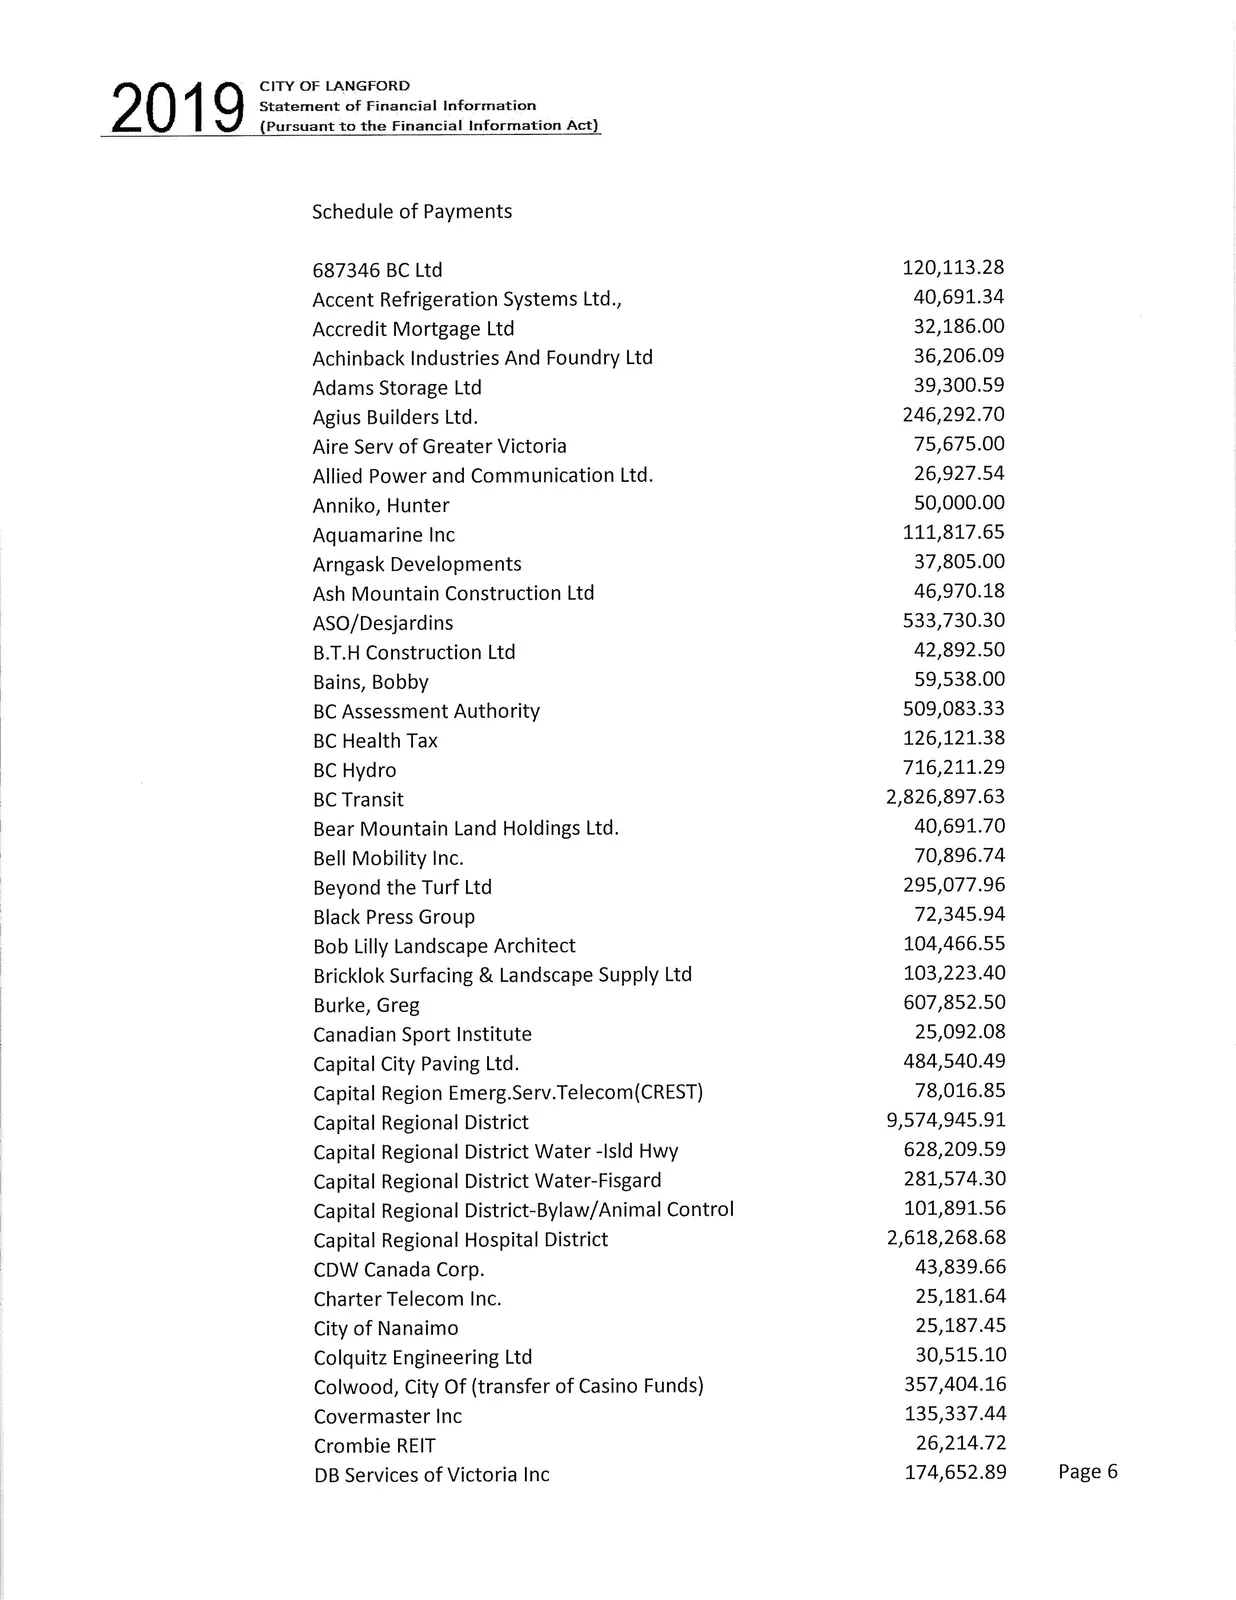
The Schedule of Payments to Suppliers has been prepared on a cash basis. The schedule includes vendor totals over $25,000 and a summary of totals.
Vendor payments (vendor — amount):
| Vendor | Amount |
|---|---|
| 687346 BC Ltd | 120,113.28 |
| Accent Refrigeration Systems Ltd. | 40,691.34 |
| Accredit Mortgage Ltd | 32,186.00 |
| Achinback Industries And Foundry Ltd | 36,206.09 |
| Adams Storage Ltd | 39,300.59 |
| Agius Builders Ltd. | 246,292.70 |
| Aire Sery of Greater Victoria | 75,675.00 |
| Allied Power and Communication Ltd. | 26,927.54 |
| Anniko, Hunter | 50,000.00 |
| Aquamarine Inc | 111,817.65 |
| Arngask Developments | 37,805.00 |
| Ash Mountain Construction Ltd | 46,970.18 |
| ASO/Desjardins | 533,730.30 |
| B.T.H Construction Ltd | 42,892.50 |
| Bains, Bobby | 59,538.00 |
| BC Assessment Authority | 509,083.33 |
| BC Health Tax | 126,121.38 |
| BC Hydro | 716,211.29 |
| BC Transit | 2,826,897.63 |
| Bear Mountain Land Holdings Ltd. | 40,691.70 |
| Bell Mobility Inc. | 70,896.74 |
| Beyond the Turf Ltd | 295,077.96 |
| Black Press Group | 72,345.94 |
| Bob Lilly Landscape Architect | 104,466.55 |
| Bricklok Surfacing & Landscape Supply Ltd | 103,223.40 |
| Burke, Greg | 607,852.50 |
| Canadian Sport Institute | 25,092.08 |
| Capital City Paving Ltd. | 484,540.49 |
| Capital Region Emerg.Serv.Telecom (CREST) | 78,016.85 |
| Capital Regional District | 9,574,945.91 |
| Capital Regional District Water -Isld Hwy | 628,209.59 |
| Capital Regional District Water-Fisgard | 281,574.30 |
| Capital Regional District-Bylaw/Animal Control | 101,891.56 |
| Capital Regional Hospital District | 2,618,268.68 |
| CDW Canada Corp. | 43,839.66 |
| Charter Telecom Inc. | 25,181.64 |
| City of Nanaimo | 25,187.45 |
| Colquitz Engineering Ltd | 30,515.10 |
| Colwood, City Of (transfer of Casino Funds) | 357,404.16 |
| Covermaster Inc | 135,337.44 |
| Cronnbie REIT | 26,214.72 |
| DB Services of Victoria Inc | 174,652.89 |
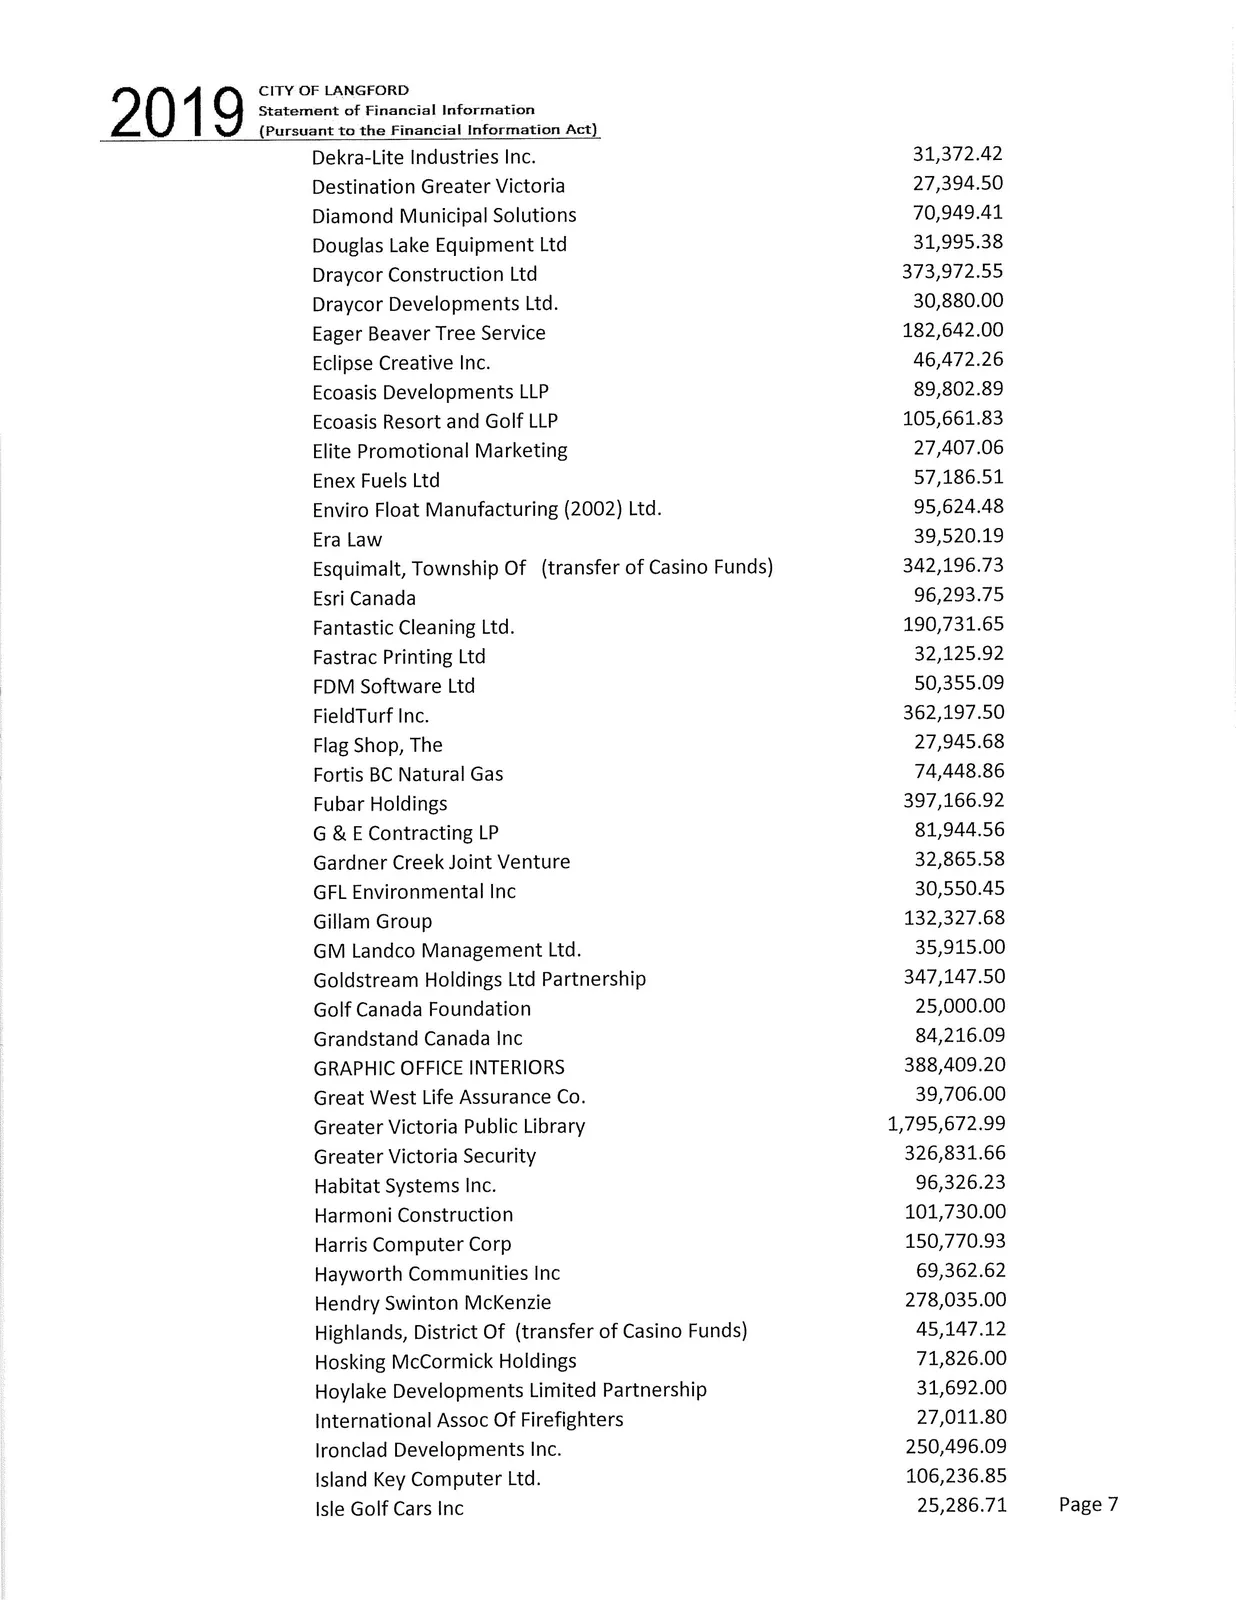
| Dekra-Lite Industries Inc. | 31,372.42 |
| Destination Greater Victoria | 27,394.50 |
| Diamond Municipal Solutions | 70,949.41 |
| Douglas Lake Equipment Ltd | 31,995.38 |
| Draycor Construction Ltd | 373,972.55 |
| Draycor Developments Ltd. | 30,880.00 |
| Eager Beaver Tree Service | 182,642.00 |
| Eclipse Creative Inc. | 46,472.26 |
| Ecoasis Developments LLP | 89,802.89 |
| Ecoasis Resort and Golf LLP | 105,661.83 |
| Elite Promotional Marketing | 27,407.06 |
| Enex Fuels Ltd | 57,186.51 |
| Enviro Float Manufacturing (2002) Ltd. | 95,624.48 |
| Era Law | 39,520.19 |
| Esquimalt, Township Of (transfer of Casino Funds) | 342,196.73 |
| Esri Canada | 96,293.75 |
| Fantastic Cleaning Ltd. | 190,731.65 |
| Fastrac Printing Ltd | 32,125.92 |
| FDM Software Ltd | 50,355.09 |
| FieldTurf Inc. | 362,197.50 |
| Flag Shop, The | 27,945.68 |
| Fortis BC Natural Gas | 74,448.86 |
| Fubar Holdings | 397,166.92 |
| G & E Contracting LP | 81,944.56 |
| Gardner Creek Joint Venture | 32,865.58 |
| GFL Environmental Inc | 30,550.45 |
| Gillam Group | 132,327.68 |
| GM Landco Management Ltd. | 35,915.00 |
| Goldstream Holdings Ltd Partnership | 347,147.50 |
| Golf Canada Foundation | 25,000.00 |
| Grandstand Canada Inc | 84,216.09 |
| GRAPHIC OFFICE INTERIORS | 388,409.20 |
| Great West Life Assurance Co. | 39,706.00 |
| Greater Victoria Public Library | 1,795,672.99 |
| Greater Victoria Security | 326,831.66 |
| Habitat Systems Inc. | 96,326.23 |
| Harmoni Construction | 101,730.00 |
| Harris Computer Corp | 150,770.93 |
| Hayworth Communities Inc | 69,362.62 |
| Hendry Swinton McKenzie | 278,035.00 |
| Highlands, District Of (transfer of Casino Funds) | 45,147.12 |
| Hosking McCormick Holdings | 71,826.00 |
| Hoylake Developments Limited Partnership | 31,692.00 |
| International Assoc Of Firefighters | 27,011.80 |
| Ironclad Developments Inc. | 250,496.09 |
| Island Key Computer Ltd. | 106,236.85 |
| Isle Golf Cars Inc | 25,286.71 |
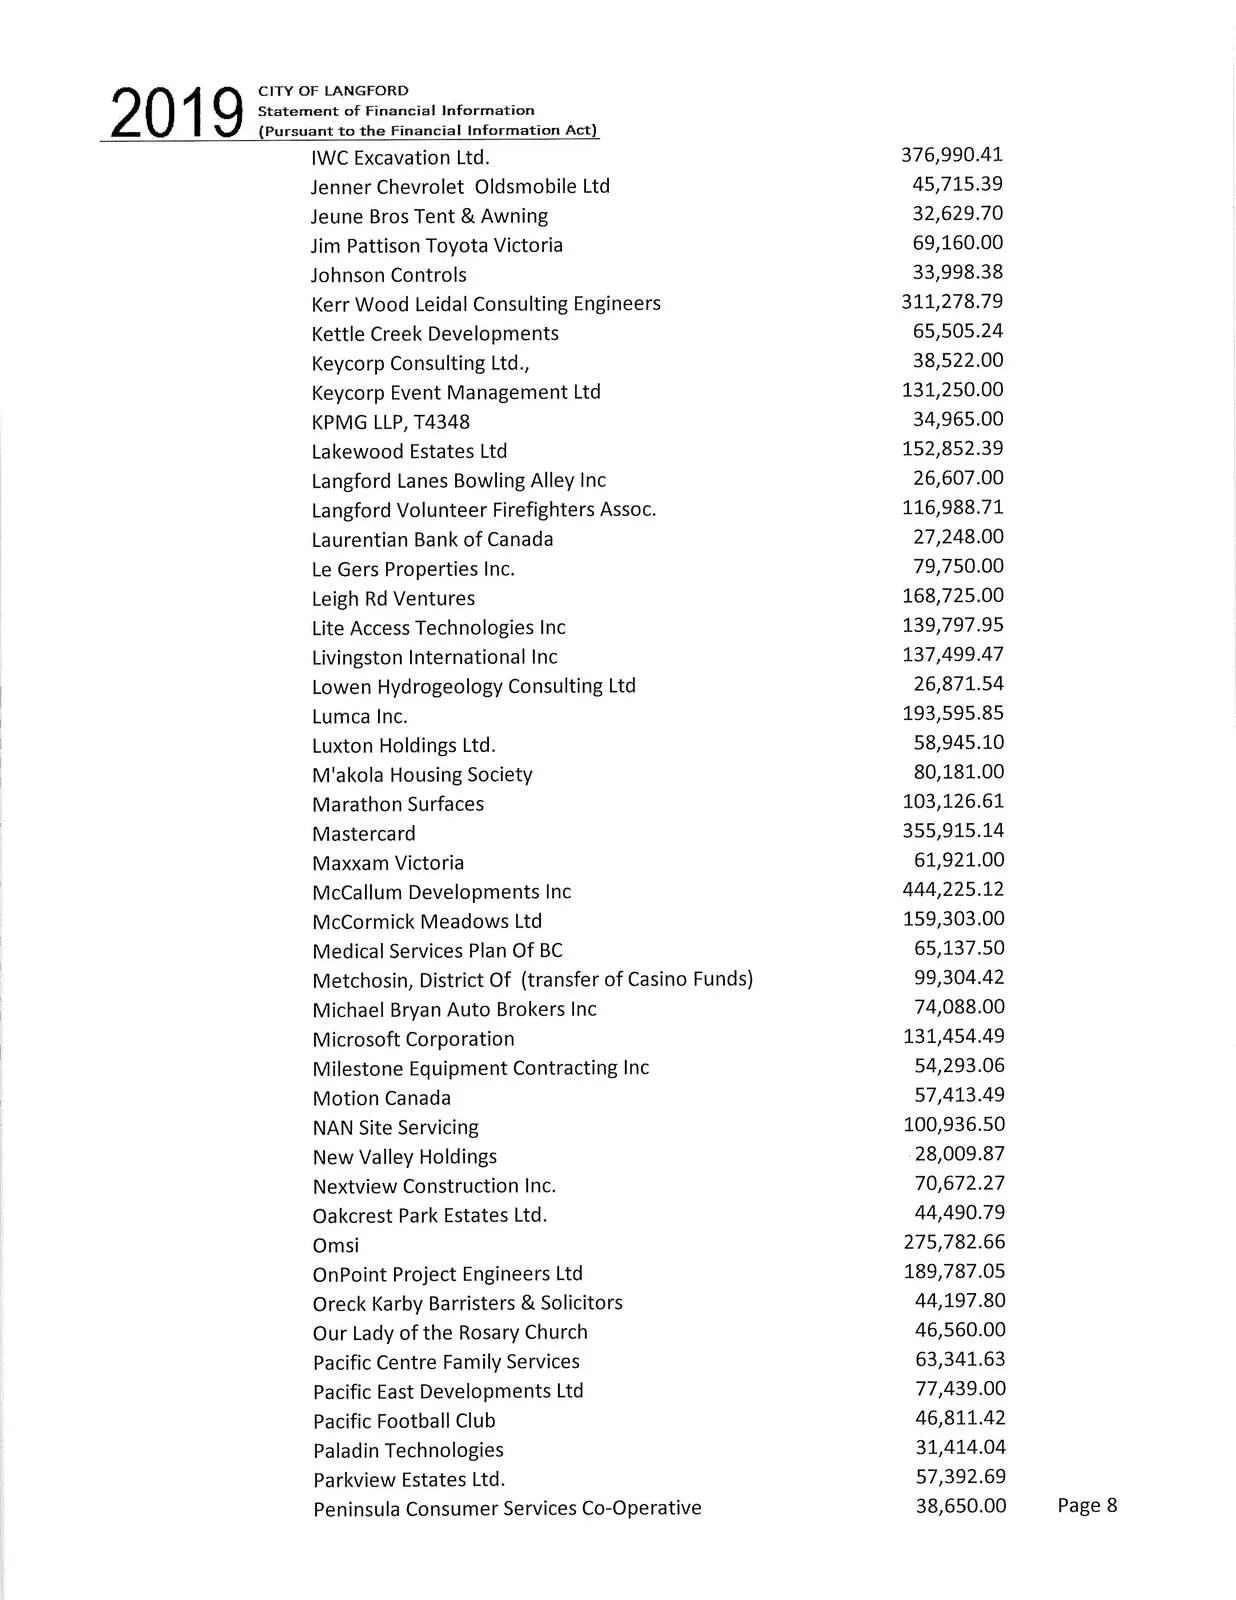
| IWC Excavation Ltd. | 376,990.41 |
| Jenner Chevrolet Oldsmobile Ltd | 45,715.39 |
| Jeune Bros Tent & Awning | 32,629.70 |
| Jim Pattison Toyota Victoria | 69,160.00 |
| Johnson Controls | 33,998.38 |
| Kerr Wood Leidal Consulting Engineers | 311,278.79 |
| Kettle Creek Developments | 65,505.24 |
| Keycorp Consulting Ltd. | 38,522.00 |
| Keycorp Event Management Ltd | 131,250.00 |
| KPMG LLP, T4348 | 34,965.00 |
| Lakewood Estates Ltd | 152,852.39 |
| Langford Lanes Bowling Alley Inc | 26,607.00 |
| Langford Volunteer Firefighters Assoc. | 116,988.71 |
| Laurentian Bank of Canada | 27,248.00 |
| Le Gers Properties Inc. | 79,750.00 |
| Leigh Rd Ventures | 168,725.00 |
| Lite Access Technologies Inc | 139,797.95 |
| Livingston International Inc | 137,499.47 |
| Lowen Hydrogeology Consulting Ltd | 26,871.54 |
| Lumca Inc. | 193,595.85 |
| Luxton Holdings Ltd. | 58,945.10 |
| M'akola Housing Society | 80,181.00 |
| Marathon Surfaces | 103,126.61 |
| Mastercard | 355,915.14 |
| Maxxam Victoria | 61,921.00 |
| McCallum Developments Inc | 444,225.12 |
| McCormick Meadows Ltd | 159,303.00 |
| Medical Services Plan Of BC | 65,137.50 |
| Metchosin, District Of (transfer of Casino Funds) | 99,304.42 |
| Michael Bryan Auto Brokers Inc | 74,088.00 |
| Microsoft Corporation | 131,454.49 |
| Milestone Equipment Contracting Inc | 54,293.06 |
| Motion Canada | 57,413.49 |
| NAN Site Servicing | 100,936.50 |
| New Valley Holdings | 28,009.87 |
| Nextview Construction Inc. | 70,672.27 |
| Oakcrest Park Estates Ltd. | 44,490.79 |
| Omsi | 275,782.66 |
| OnPoint Project Engineers Ltd | 189,787.05 |
| Oreck Karby Barristers & Solicitors | 44,197.80 |
| Our Lady of the Rosary Church | 46,560.00 |
| Pacific Centre Family Services | 63,341.63 |
| Pacific East Developments Ltd | 77,439.00 |
| Pacific Football Club | 46,811.42 |
| Paladin Technologies | 31,414.04 |
| Parkview Estates Ltd. | 57,392.69 |
| Peninsula Consumer Services Co-Operative | 38,650.00 |
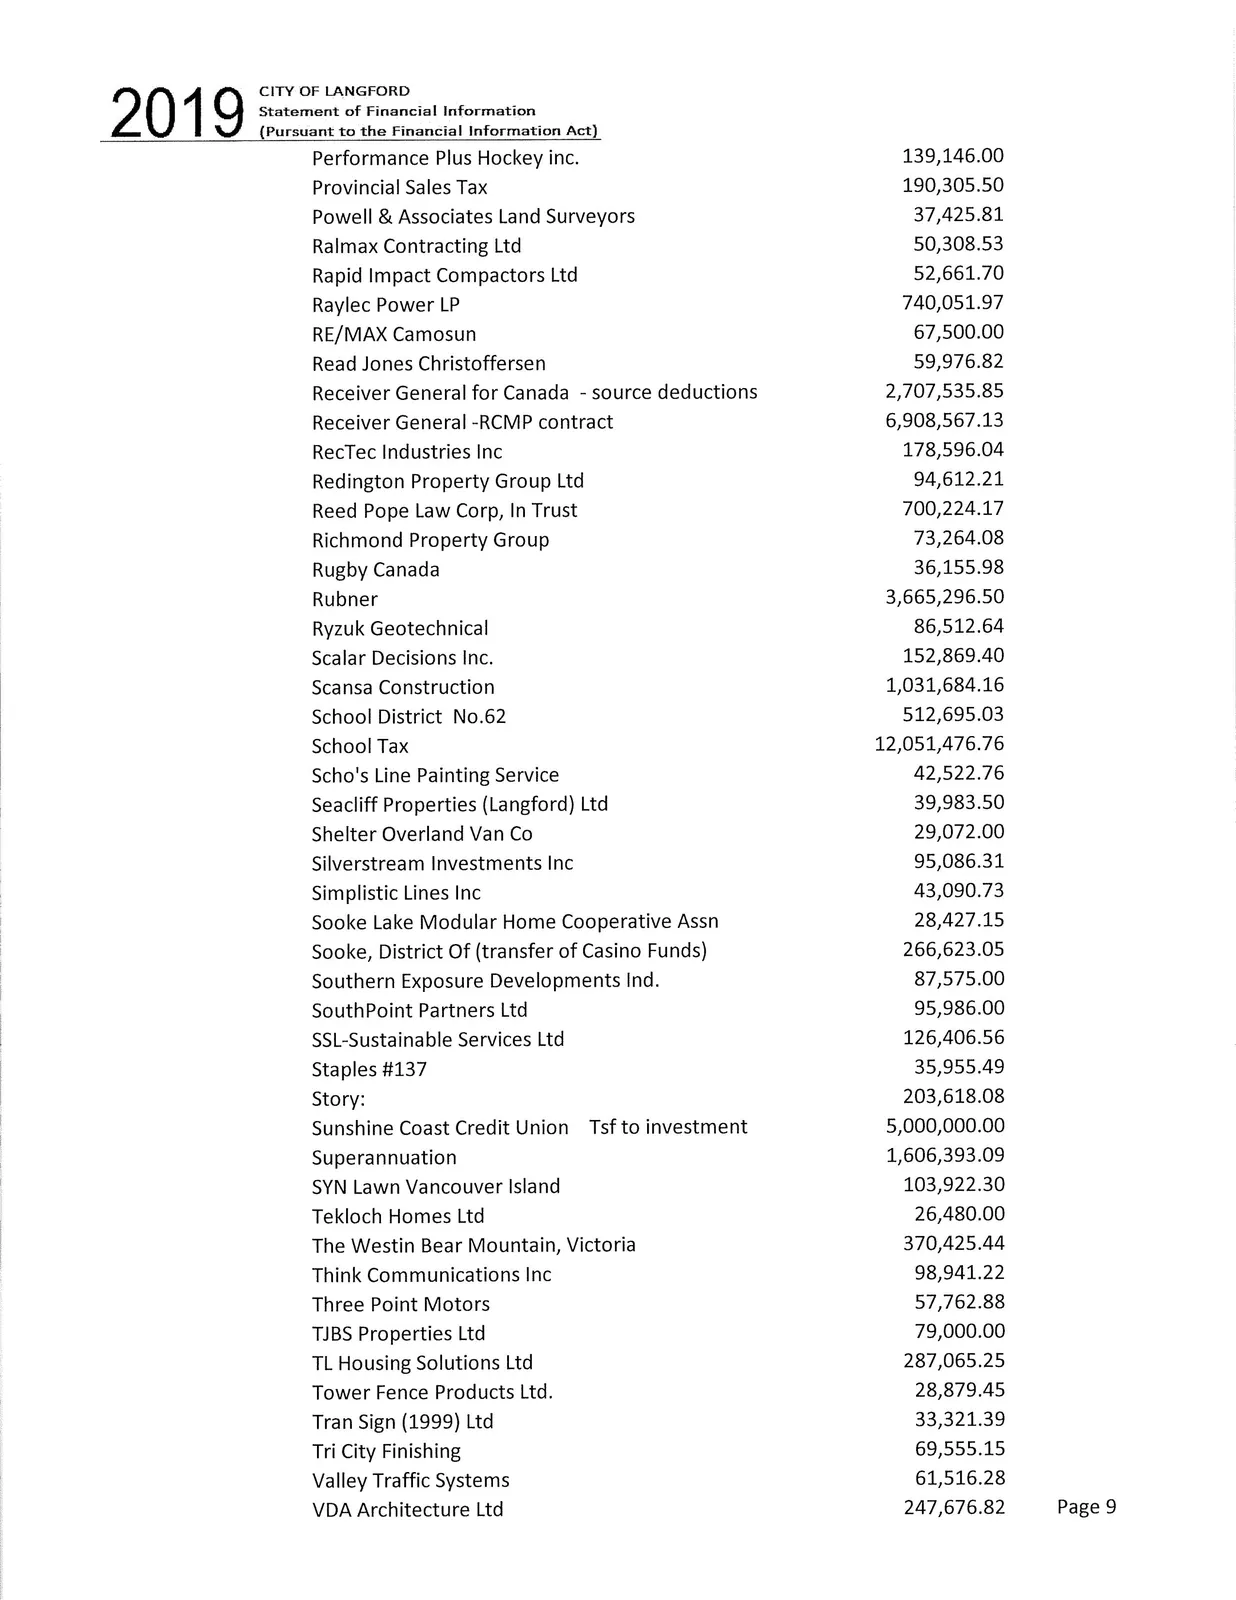
| Performance Plus Hockey inc. | 139,146.00 |
| Provincial Sales Tax | 190,305.50 |
| Powell & Associates Land Surveyors | 37,425.81 |
| Ralmax Contracting Ltd | 50,308.53 |
| Rapid Impact Compactors Ltd | 52,661.70 |
| Raylec Power LP | 740,051.97 |
| RE/MAX Camosun | 67,500.00 |
| Read Jones Christoffersen | 59,976.82 |
| Receiver General for Canada - source deductions | 2,707,535.85 |
| Receiver General -RCMP contract | 6,908,567.13 |
| RecTec Industries Inc | 178,596.04 |
| Redington Property Group Ltd | 94,612.21 |
| Reed Pope Law Corp, In Trust | 700,224.17 |
| Richmond Property Group | 73,264.08 |
| Rugby Canada | 36,155.98 |
| Rubner | 3,665,296.50 |
| Ryzuk Geotechnica I | 86,512.64 |
| Scalar Decisions Inc. | 152,869.40 |
| Scansa Construction | 1,031,684.16 |
| School District No.62 | 512,695.03 |
| School Tax | 12,051,476.76 |
| Scho's Line Painting Service | 42,522.76 |
| Seacliff Properties (Langford) Ltd | 39,983.50 |
| Shelter Overland Van Co | 29,072.00 |
| Silverstream Investments Inc | 95,086.31 |
| Simplistic Lines Inc | 43,090.73 |
| Sooke Lake Modular Home Cooperative Assn | 28,427.15 |
| Sooke, District Of (transfer of Casino Funds) | 266,623.05 |
| Southern Exposure Developments Ind. | 87,575.00 |
| SouthPoint Partners Ltd | 95,986.00 |
| SSL-Sustainable Services Ltd | 126,406.56 |
| Staples #137 | 35,955.49 |
| Story: | 203,618.08 |
| Sunshine Coast Credit Union - Tsf to investment | 5,000,000.00 |
| Superannuation | 1,606,393.09 |
| SYN Lawn Vancouver Island | 103,922.30 |
| Tekloch Homes Ltd | 26,480.00 |
| The Westin Bear Mountain, Victoria | 370,425.44 |
| Think Communications Inc | 98,941.22 |
| Three Point Motors | 57,762.88 |
| TJBS Properties Ltd | 79,000.00 |
| TL Housing Solutions Ltd | 287,065.25 |
| Tower Fence Products Ltd. | 28,879.45 |
| Tran Sign (1999) Ltd | 33,321.39 |
| Tri City Finishing | 69,555.15 |
| Valley Traffic Systems | 61,516.28 |
| VDA Architecture Ltd | 247,676.82 |
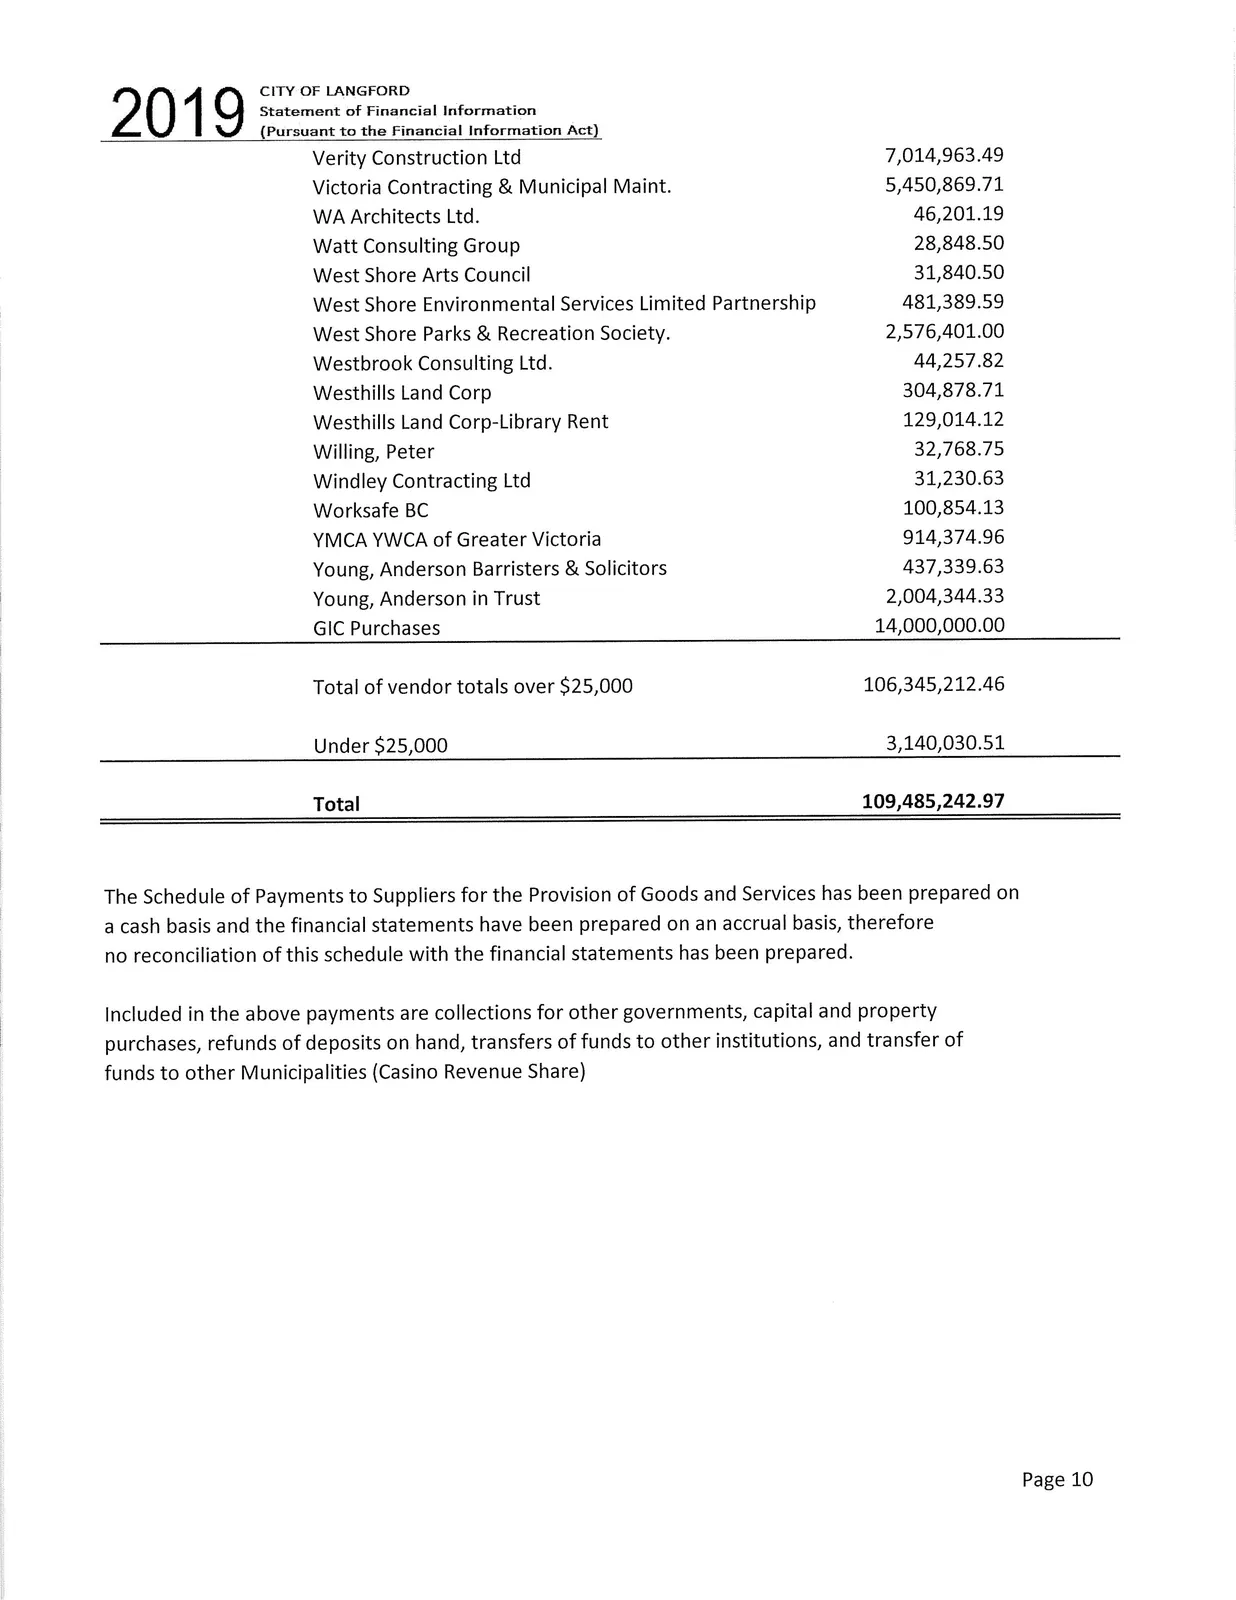
| Verity Construction Ltd | 7,014,963.49 |
| Victoria Contracting & Municipal Maint. | 5,450,869.71 |
| WA Architects Ltd. | 46,201.19 |
| Watt Consulting Group | 28,848.50 |
| West Shore Arts Council | 31,840.50 |
| West Shore Environmental Services Limited Partnership | 481,389.59 |
| West Shore Parks & Recreation Society. | 2,576,401.00 |
| Westbrook Consulting Ltd. | 44,257.82 |
| Westhills Land Corp | 304,878.71 |
| Westhills Land Corp-Library Rent | 129,014.12 |
| Willing, Peter | 32,768.75 |
| Windley Contracting Ltd | 31,230.63 |
| Worksafe BC | 100,854.13 |
| YMCA YWCA of Greater Victoria | 914,374.96 |
| Young, Anderson Barristers & Solicitors | 437,339.63 |
| Young, Anderson in Trust | 2,004,344.33 |
| GIC Purchases | 14,000,000.00 |
Summary totals:
- Total of vendor totals over $25,000: 106,345,212.46
- Under $25,000: 3,140,030.51
- Total: 109,485,242.97
Notes: The Schedule of Payments to Suppliers for the Provision of Goods and Services has been prepared on a cash basis and the financial statements have been prepared on an accrual basis, therefore no reconciliation of this schedule with the financial statements has been prepared. Included in the above payments are collections for other governments, capital and property purchases, refunds of deposits on hand, transfers of funds to other institutions, and transfer of funds to other Municipalities (Casino Revenue Share).
Audited Financial Statements
Consolidated Financial Statements for the fiscal year ending December 31, 2019.
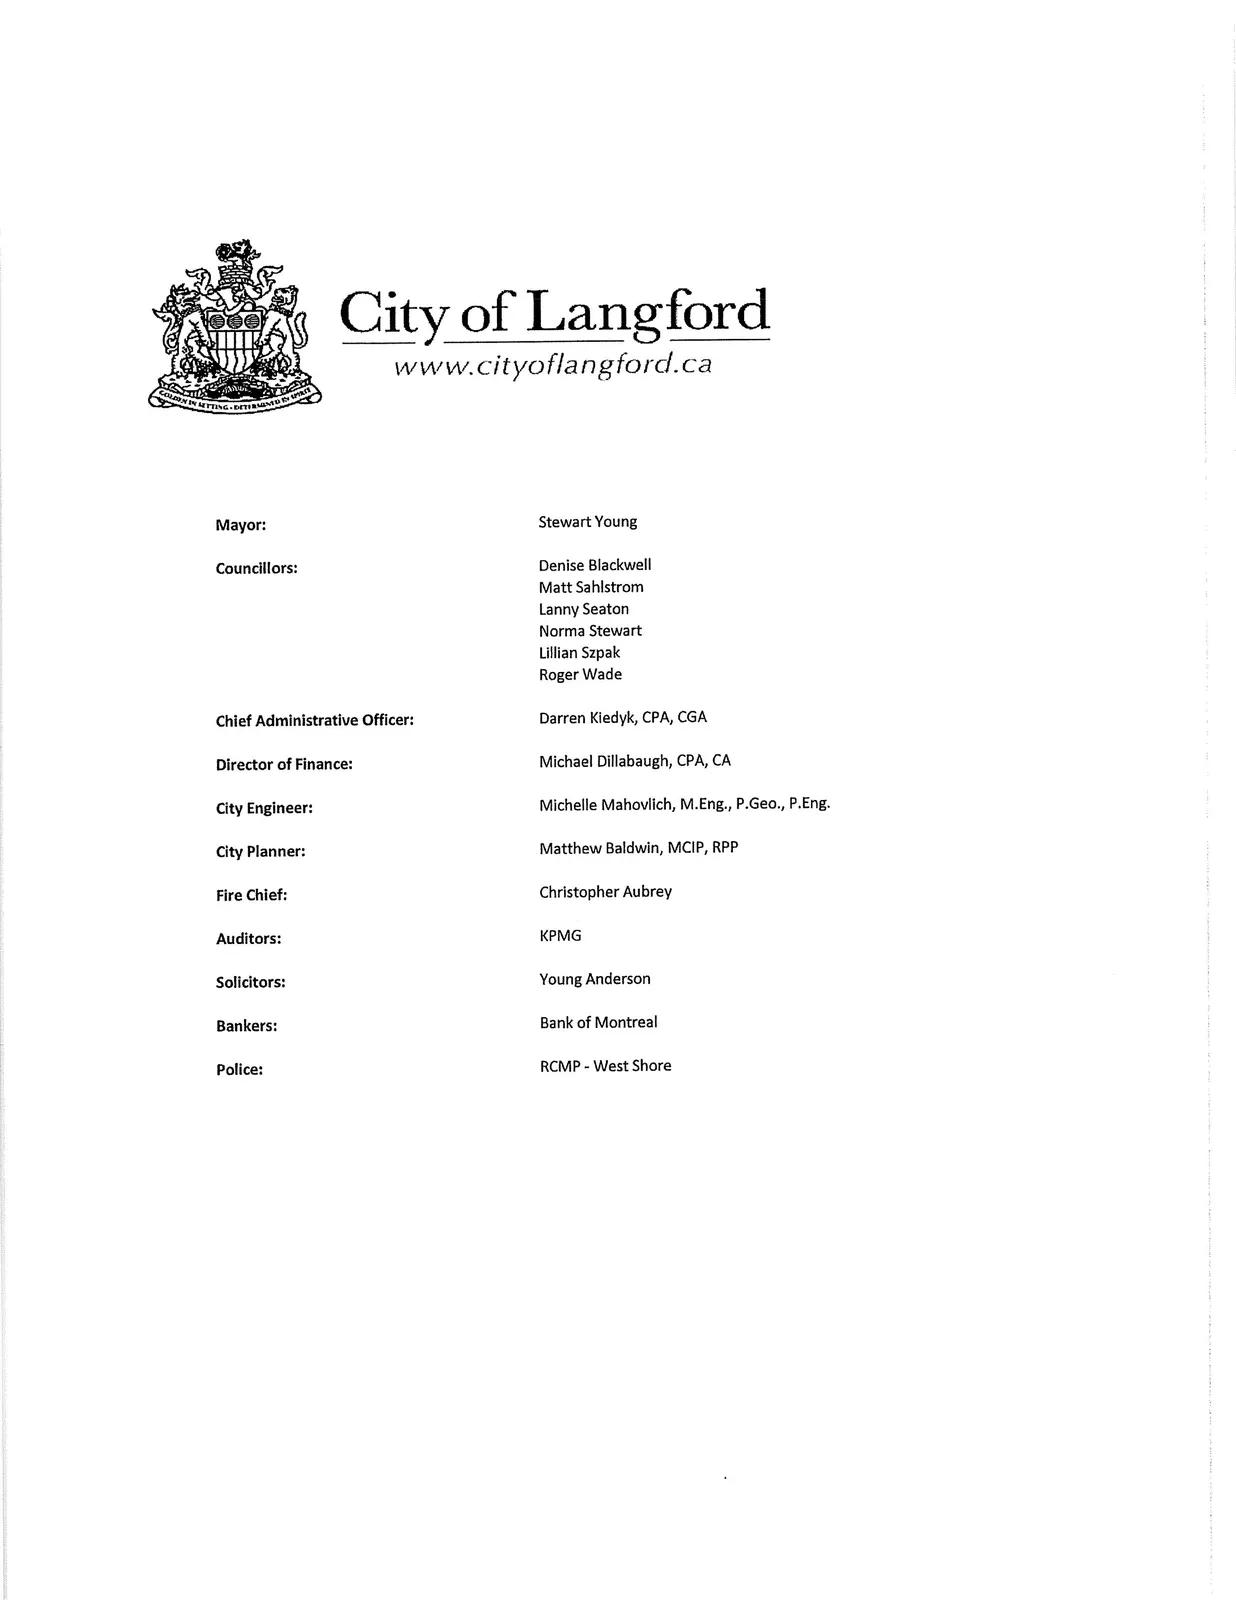
City Officials and Advisors
- Mayor: Stewart Young
- Councillors: Denise Blackwell; Matt Sahlstrom; Lanny Seaton; Norma Stewart; Lillian Szpak; Roger Wade
- Chief Administrative Officer: Darren Kiedyk, CPA, CGA
- Director of Finance: Michael Dillabaugh, CPA, CA
- City Engineer: Michelle Mahovlich, M.Eng., P.Geo., P.Eng.
- City Planner: Matthew Baldwin, MCIP, RPP
- Fire Chief: Christopher Aubrey
- Auditors: KPMG
- Solicitors: Young Anderson
- Bankers: Bank of Montreal
- Police: RCMP - West Shore
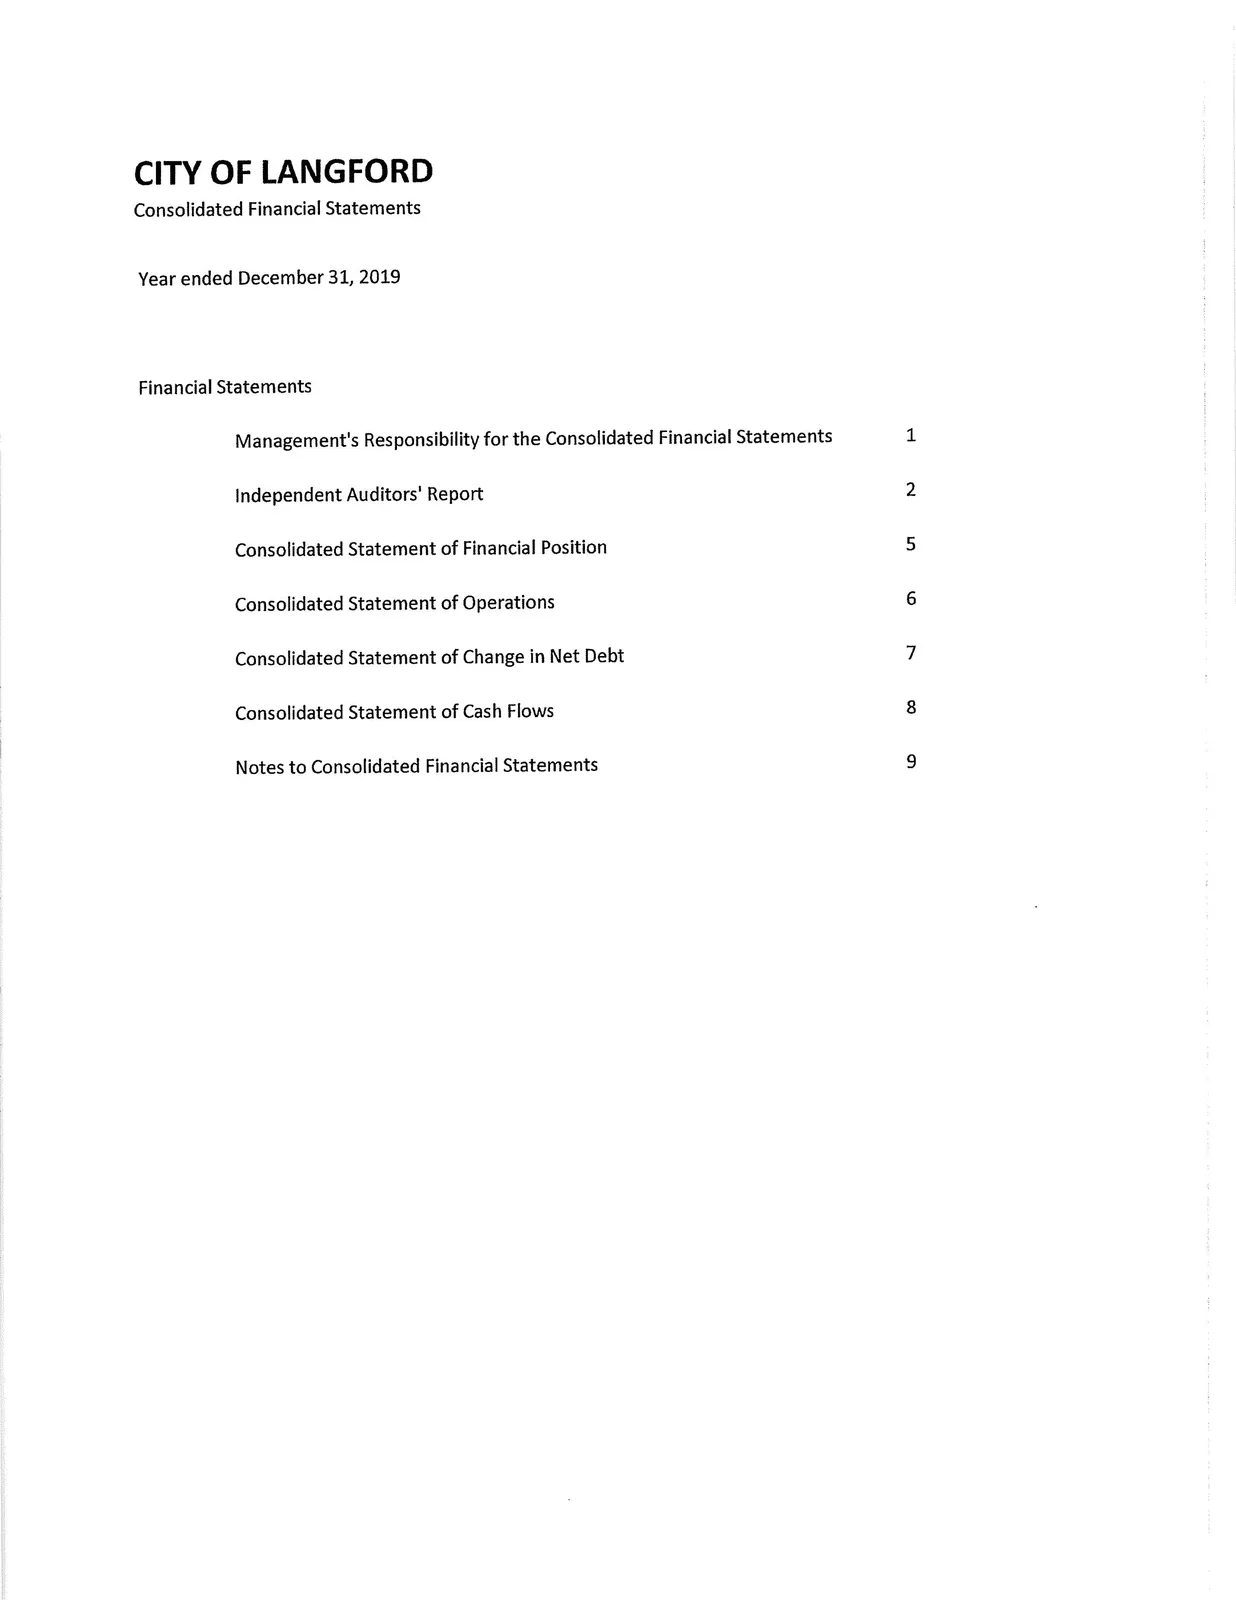
Contents
- Management's Responsibility for the Consolidated Financial Statements
- Independent Auditors' Report
- Consolidated Statement of Financial Position
- Consolidated Statement of Operations
- Consolidated Statement of Change in Net Debt
- Consolidated Statement of Cash Flows
- Notes to Consolidated Financial Statements
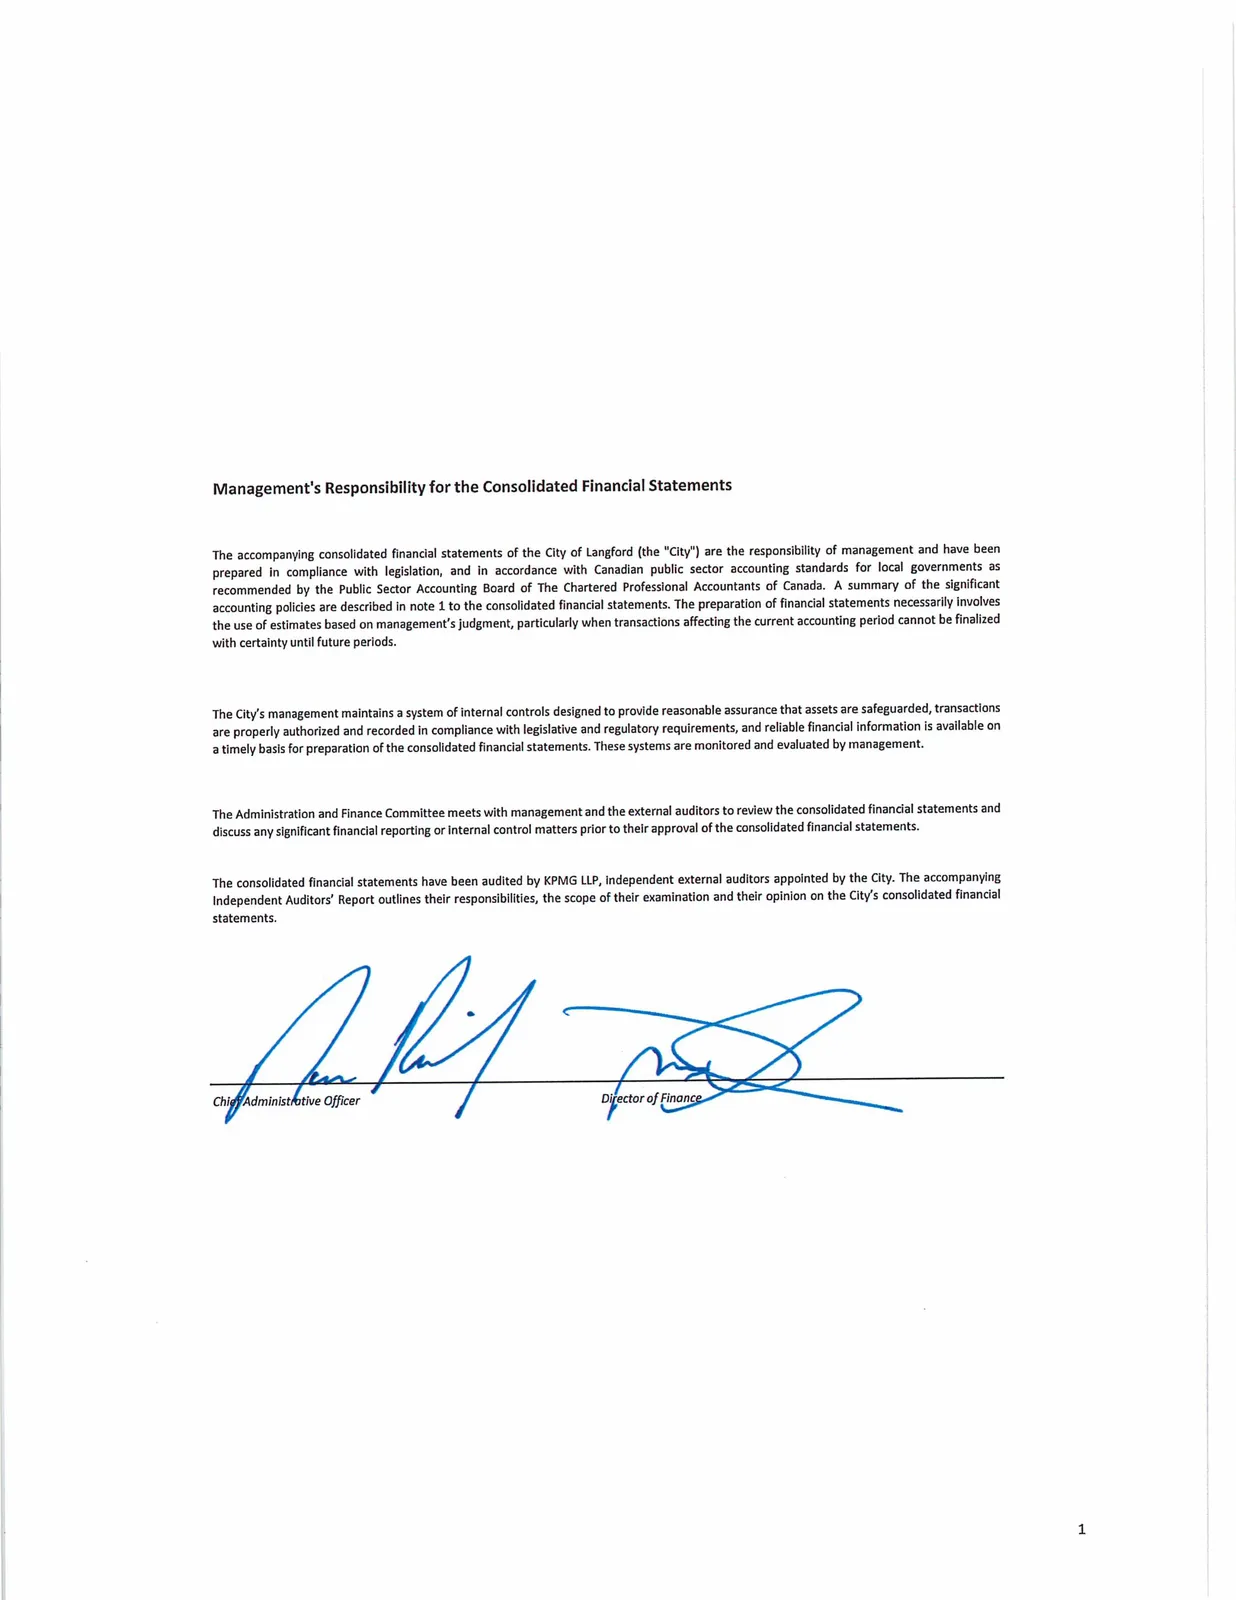
Management's Responsibility for the Consolidated Financial Statements
Management is responsible for the preparation and fair presentation of the consolidated financial statements in accordance with Canadian public sector accounting standards for local governments as recommended by the Public Sector Accounting Board. The Administration and Finance Committee meets with management and the external auditors to review and discuss the consolidated financial statements. The consolidated financial statements have been audited by KPMG LLP.
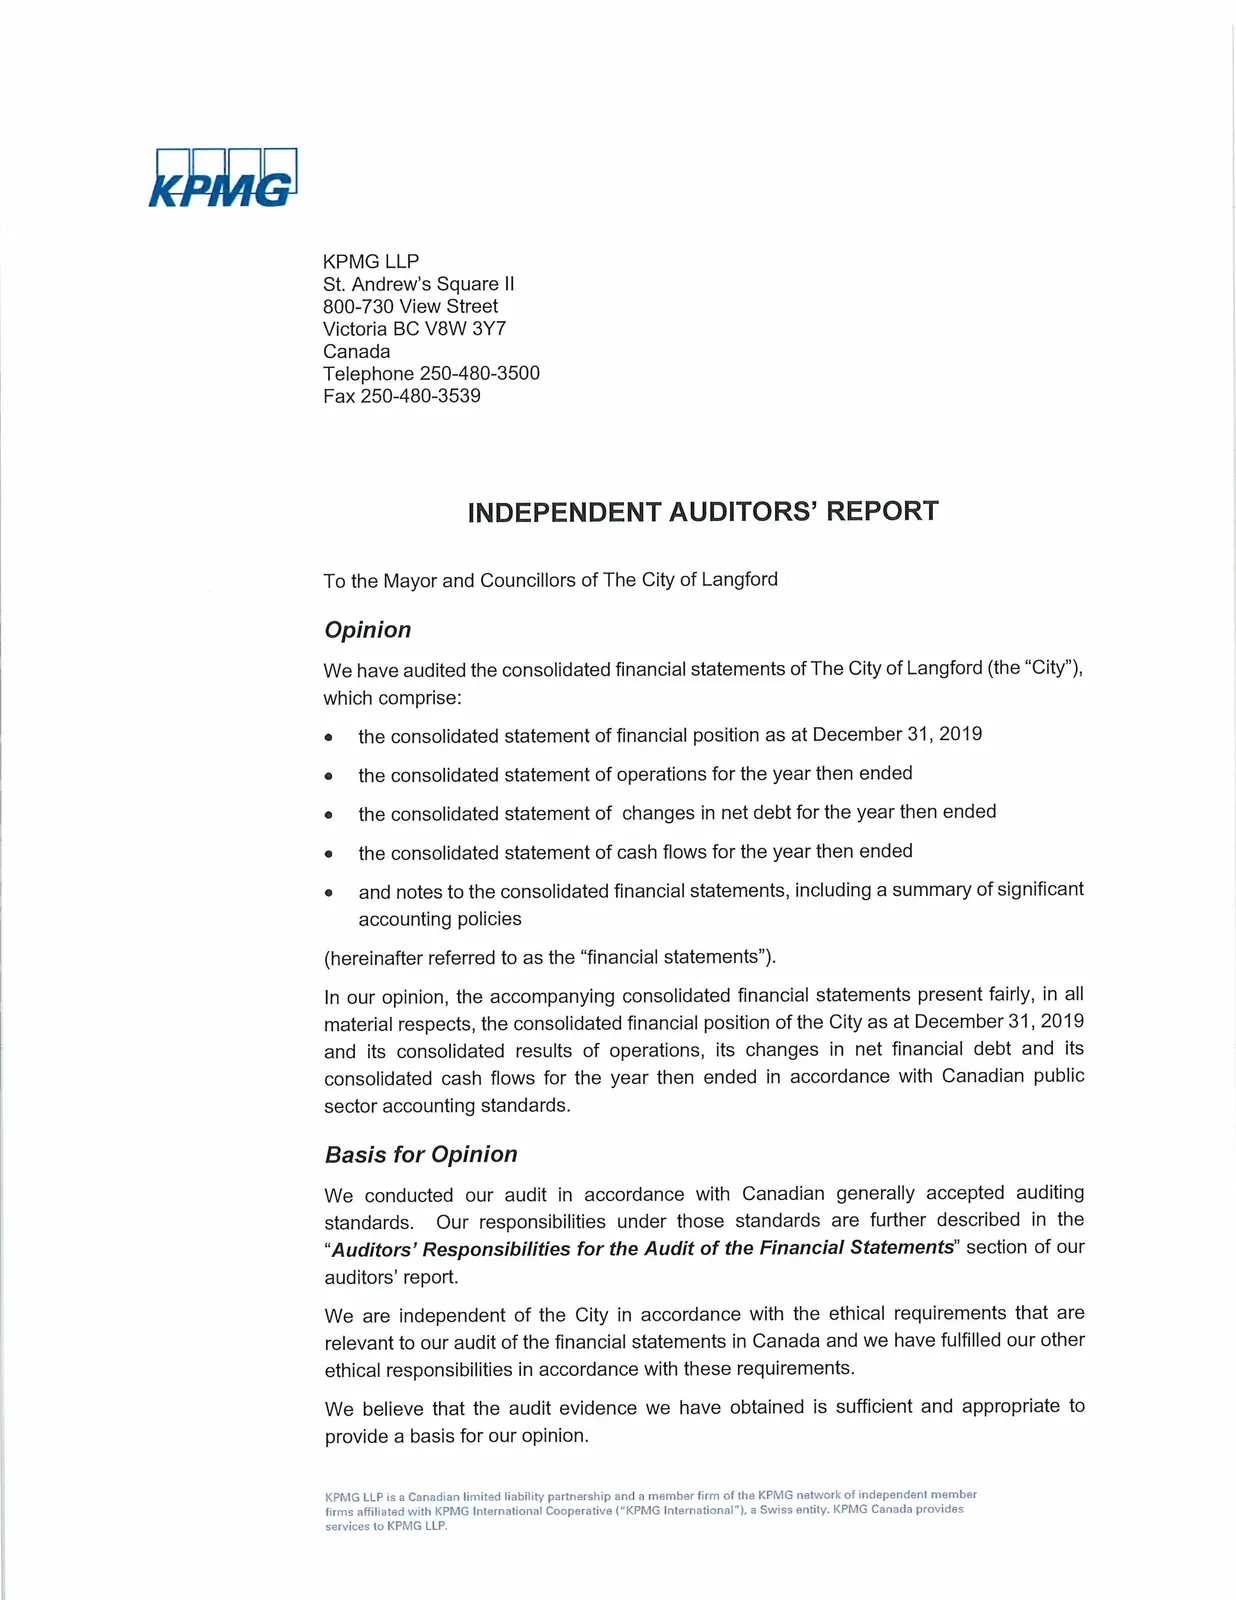
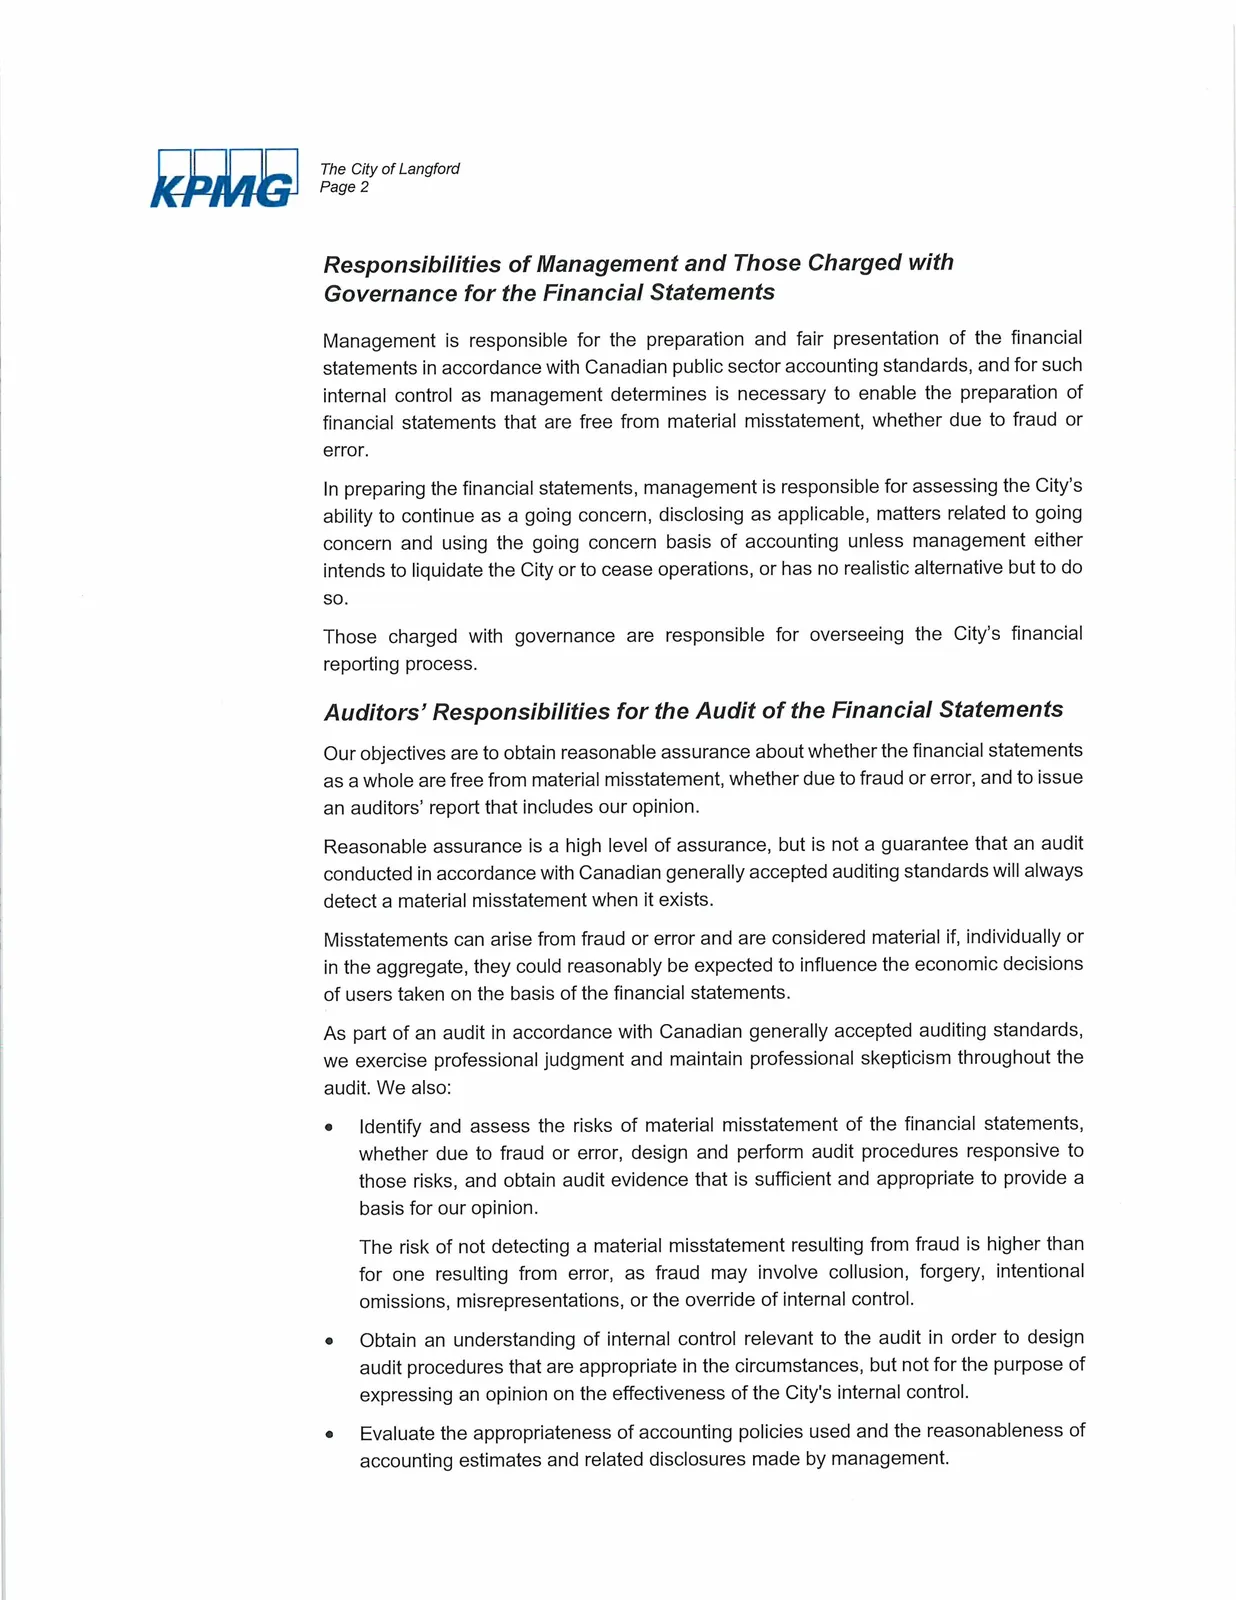
Independent Auditors' Report (KPMG LLP)
- Audit opinion: The consolidated financial statements present fairly, in all material respects, the consolidated financial position of the City as at December 31, 2019 and its consolidated results of operations, changes in net financial debt and consolidated cash flows for the year then ended in accordance with Canadian public sector accounting standards.
- Date: May 4, 2020
- Address: KPMG LLP, St. Andrew's Square II, 800-730 View Street, Victoria BC V8W 3Y7
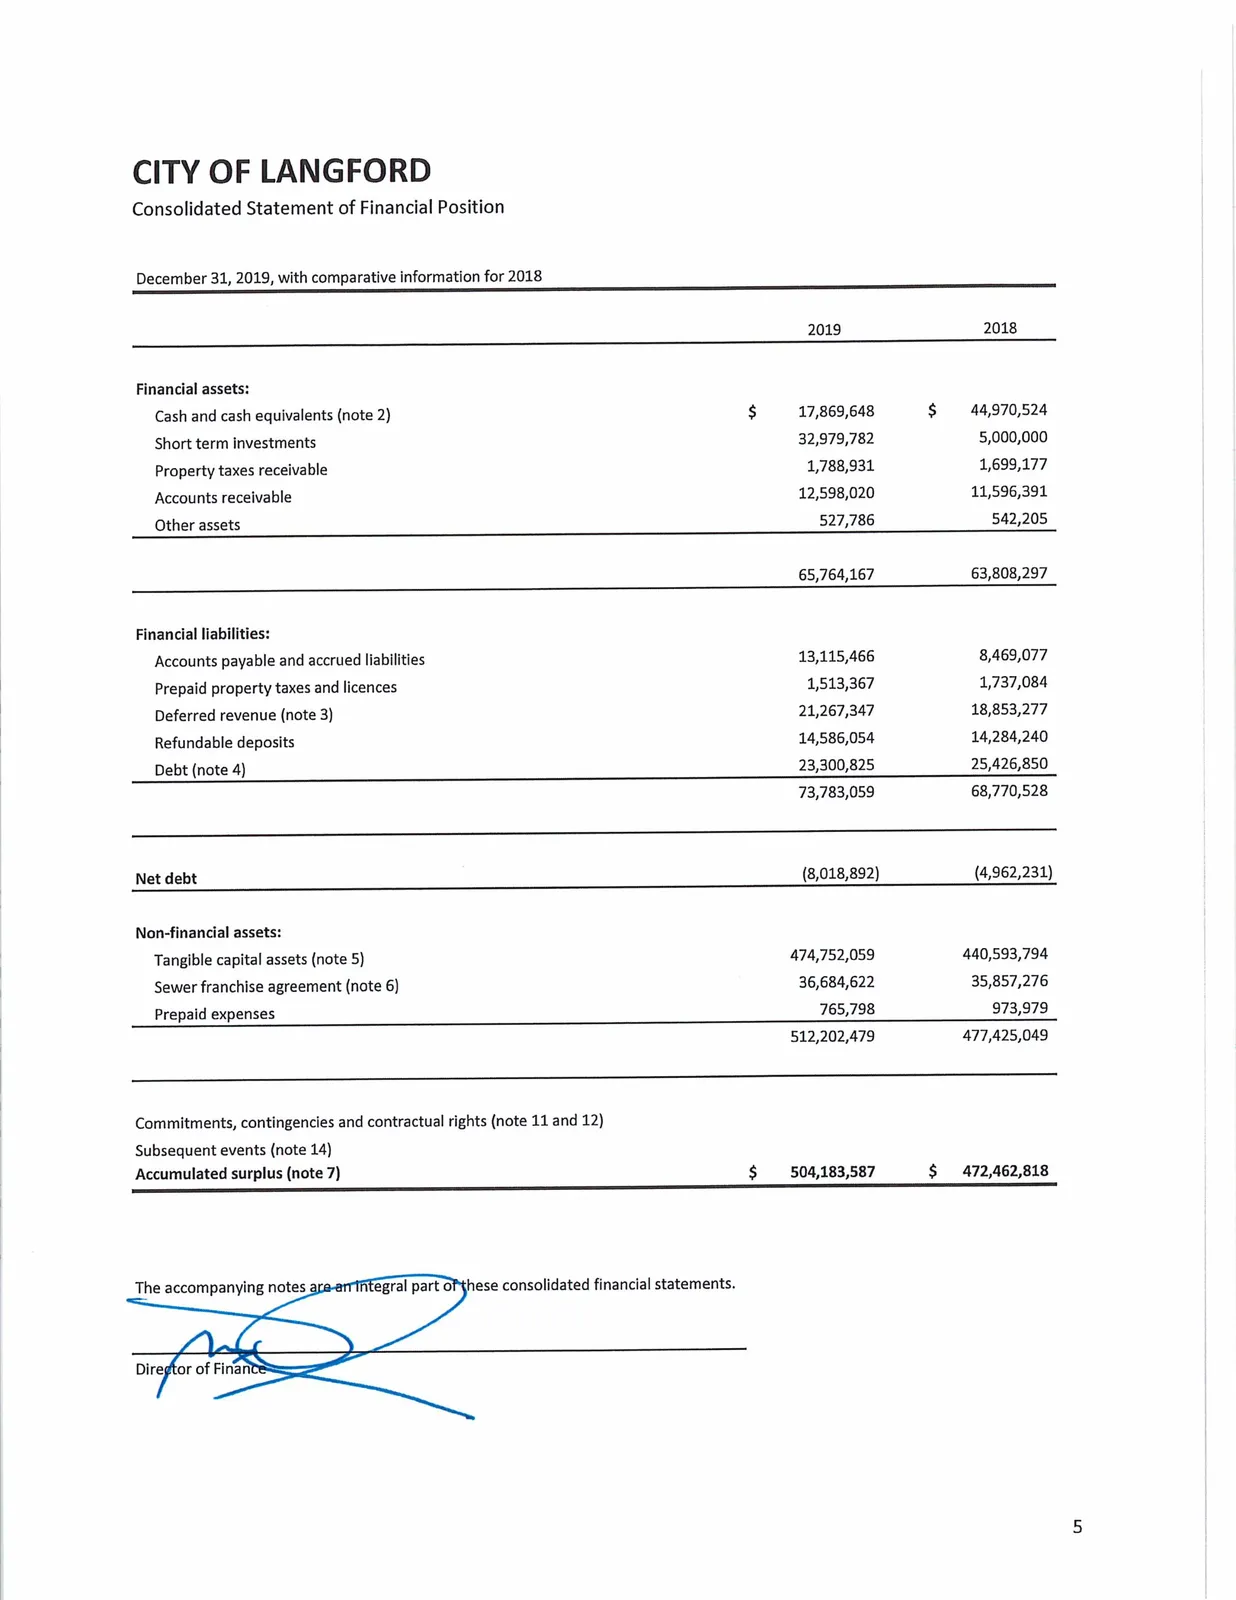
Consolidated Statement of Financial Position
As at December 31, 2019 (comparatives for 2018)
| 2019 | 2018 | |
|---|---|---|
| Financial assets: | ||
| Cash and cash equivalents (note 2) | $17,869,648 | $44,970,524 |
| Short term investments | 32,979,782 | 5,000,000 |
| Property taxes receivable | 1,788,931 | 1,699,177 |
| Accounts receivable | 12,598,020 | 11,596,391 |
| Other assets | 527,786 | 542,205 |
| Total financial assets | 65,764,167 | 63,808,297 |
| Financial liabilities: | ||
| Accounts payable and accrued liabilities | 13,115,466 | 8,469,077 |
| Prepaid property taxes and licences | 1,513,367 | 1,737,084 |
| Deferred revenue (note 3) | 21,267,347 | 18,853,277 |
| Refundable deposits | 14,586,054 | 14,284,240 |
| Debt (note 4) | 23,300,825 | 25,426,850 |
| Total financial liabilities | 73,783,059 | 68,770,528 |
| Net debt | (8,018,892) | (4,962,231) |
| Non-financial assets: | ||
| Tangible capital assets (note 5) | 474,752,059 | 440,593,794 |
| Sewer franchise agreement (note 6) | 36,684,622 | 35,857,276 |
| Prepaid expenses | 765,798 | 973,979 |
| Total non-financial assets | 512,202,479 | 477,425,049 |
| Accumulated surplus (note 7) | $504,183,587 | $472,462,818 |
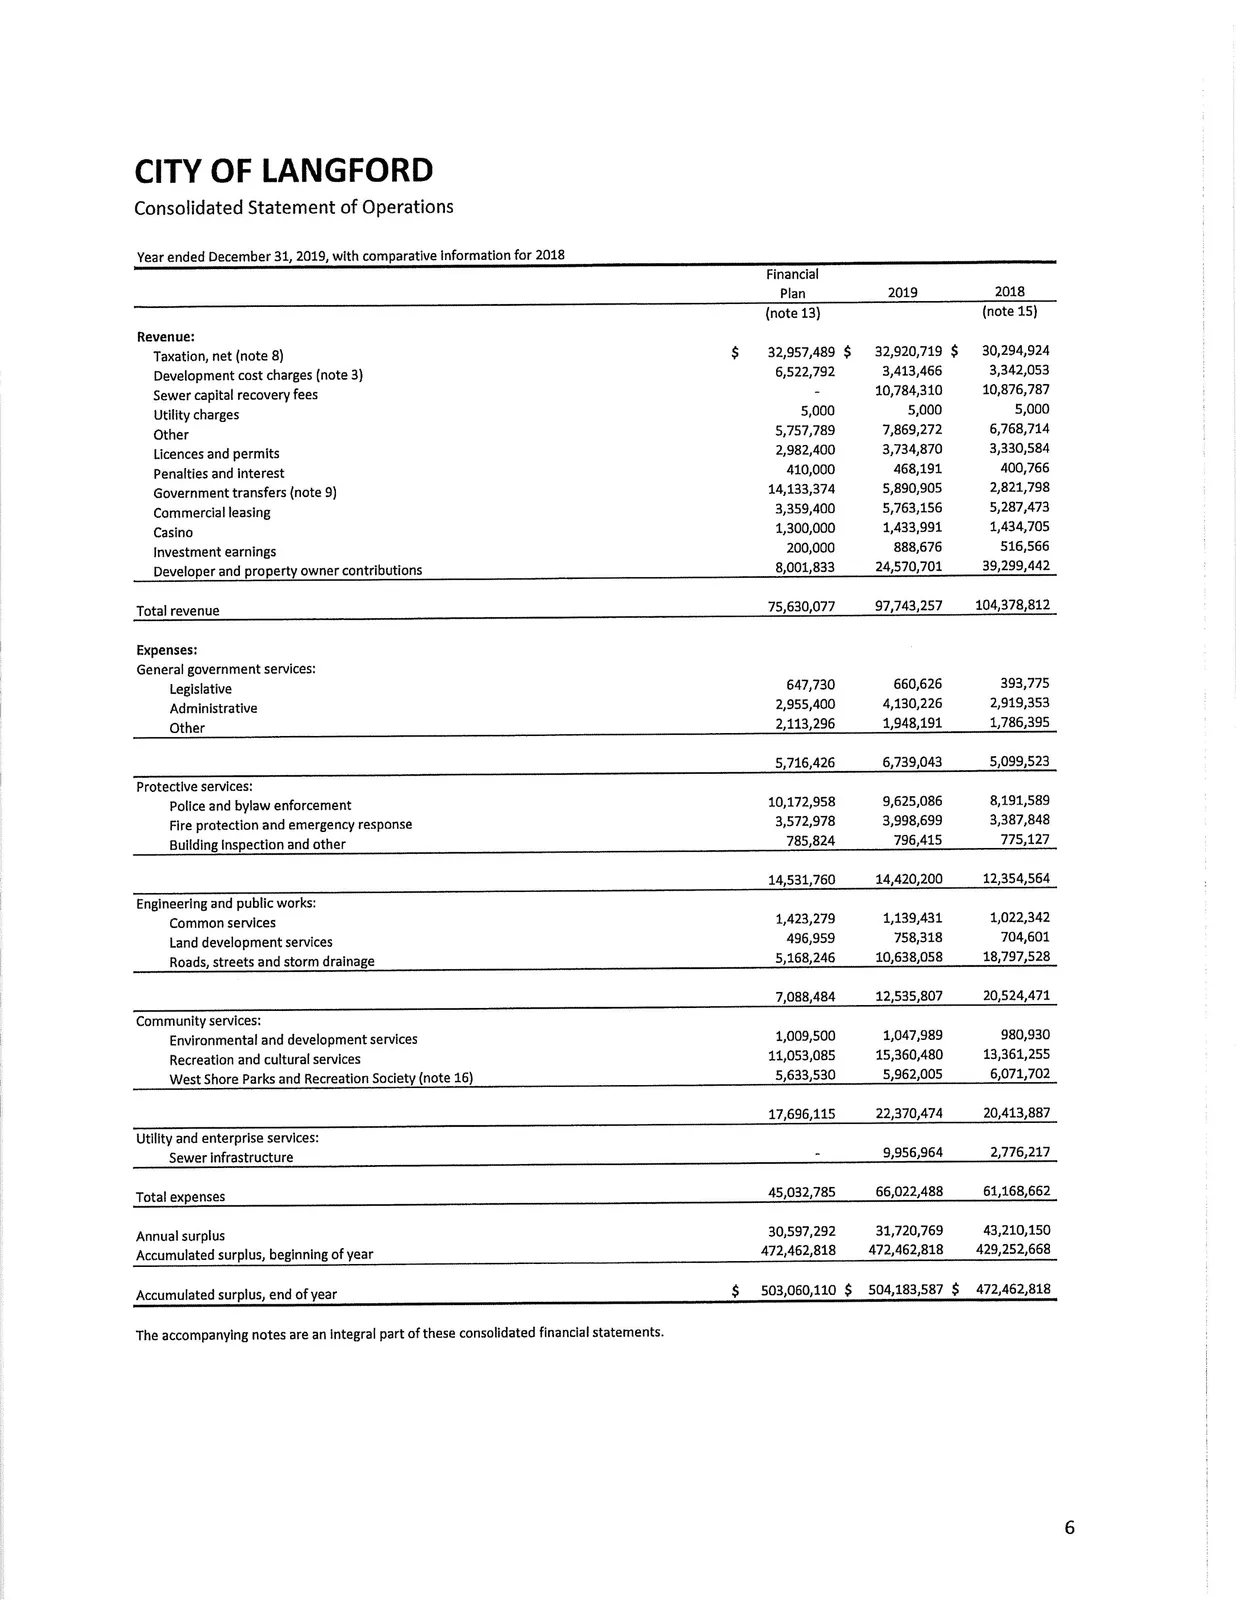
Consolidated Statement of Operations
Year ended December 31, 2019 (comparatives for 2018) — includes Financial Plan (note 13)
Revenue:
| Revenue Type | Financial Plan (note 13) | 2019 | 2018 |
|---|---|---|---|
| Taxation, net (note 8) | $32,957,489 | $32,920,719 | $30,294,924 |
| Development cost charges (note 3) | 6,522,792 | 3,413,466 | 3,342,053 |
| Sewer capital recovery fees | 10,784,310 | 10,876,787 | |
| Utility charges | 5,000 | 5,000 | 5,000 |
| Other | 5,757,789 | 7,869,272 | 6,768,714 |
| Licences and permits | 2,982,400 | 3,734,870 | 3,330,584 |
| Penalties and interest | 410,000 | 468,191 | 400,766 |
| Government transfers (note 9) | 14,133,374 | 5,890,905 | 2,821,798 |
| Commercial leasing | 3,359,400 | 5,763,156 | 5,287,473 |
| Casino | 1,300,000 | 1,433,991 | 1,434,705 |
| Investment earnings | 200,000 | 888,676 | 516,566 |
| Developer and property owner contributions | 8,001,833 | 24,570,701 | 39,299,442 |
| Total revenue | 75,630,077 | 97,743,257 | 104,378,812 |
Expenses:
| Function | Financial Plan | 2019 | 2018 |
|---|---|---|---|
| General government services (Legislative, Administrative, Other) | 5,716,426 | 6,739,043 | 5,099,523 |
| Protective services (Police and bylaw, Fire, Building Inspection) | 14,531,760 | 14,420,200 | 12,354,564 |
| Engineering and public works (Common, Land dev, Roads/storm) | 7,088,484 | 12,535,807 | 20,524,471 |
| Community services (Environmental & dev, Recreation & cultural, West Shore) | 17,696,115 | 22,370,474 | 20,413,887 |
| Utility and enterprise services (Sewer infrastructure) | 9,956,964 | 2,776,217 | |
| Total expenses | 45,032,785 | 66,022,488 | 61,168,662 |
- Annual surplus: Financial Plan $30,597,292; 2019 $31,720,769; 2018 $43,210,150
- Accumulated surplus, beginning of year 2019: $472,462,818
- Accumulated surplus, end of year 2019: $504,183,587
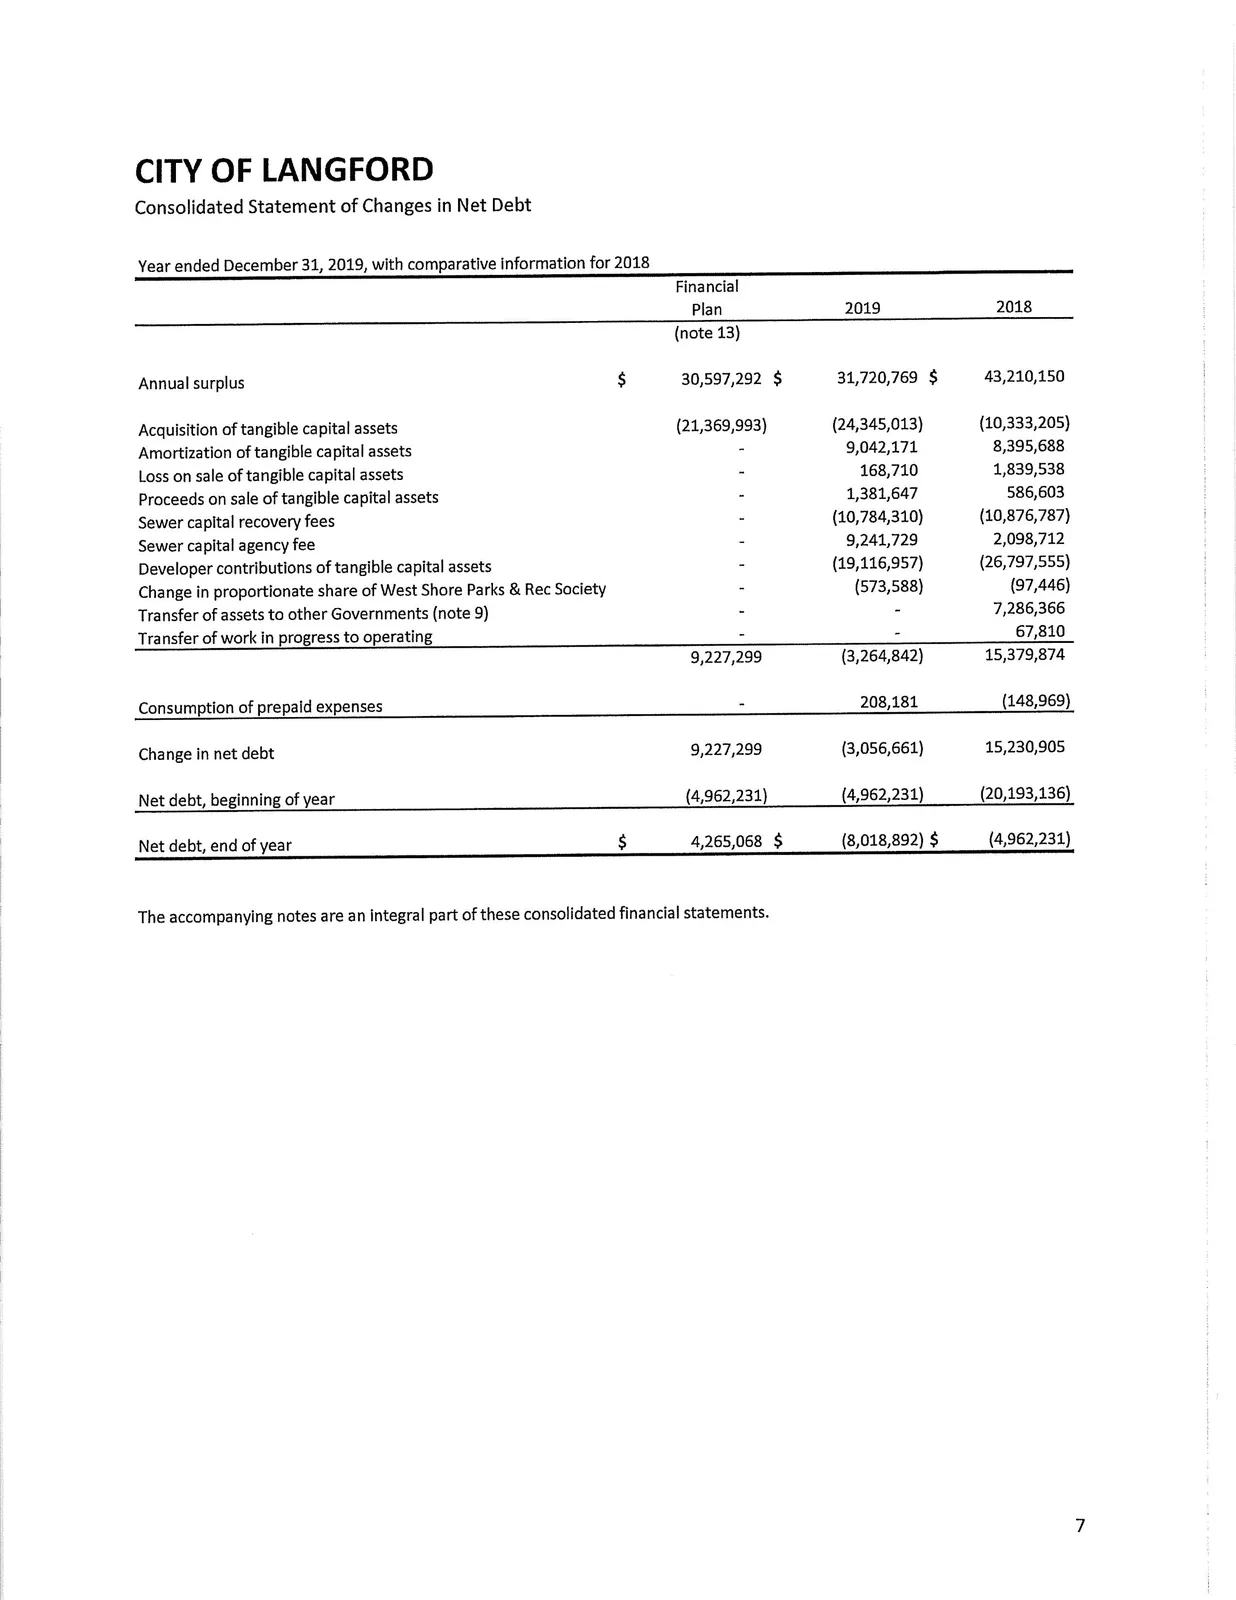
Consolidated Statement of Changes in Net Debt
Year ended December 31, 2019 (comparatives for 2018)
| Financial Plan (note 13) | 2019 | 2018 | |
|---|---|---|---|
| Annual surplus | $30,597,292 | $31,720,769 | $43,210,150 |
| Acquisition of tangible capital assets | (21,369,993) | (24,345,013) | (10,333,205) |
| Amortization of tangible capital assets | 9,042,171 | 8,395,688 | |
| Loss on sale of tangible capital assets | 168,710 | 1,839,538 | |
| Proceeds on sale of tangible capital assets | 1,381,647 | 586,603 | |
| Sewer capital recovery fees | (10,784,310) | (10,876,787) | |
| Sewer capital agency fee | 9,241,729 | 2,098,712 | |
| Developer contributions of tangible capital assets | (19,116,957) | (26,797,555) | |
| Change in proportionate share of West Shore Parks & Rec Society | (573,588) | (97,446) | |
| Transfer of assets to other Governments (note 9) | 7,286,366 | ||
| Transfer of work in progress to operating | 67,810 | ||
| Consumption of prepaid expenses | 208,181 | (148,969) | |
| Change in net debt | 9,227,299 | (3,056,661) | 15,230,905 |
| Net debt, beginning of year | (4,962,231) | (4,962,231) | (20,193,136) |
| Net debt, end of year | $4,265,068 | $(8,018,892) | $(4,962,231) |
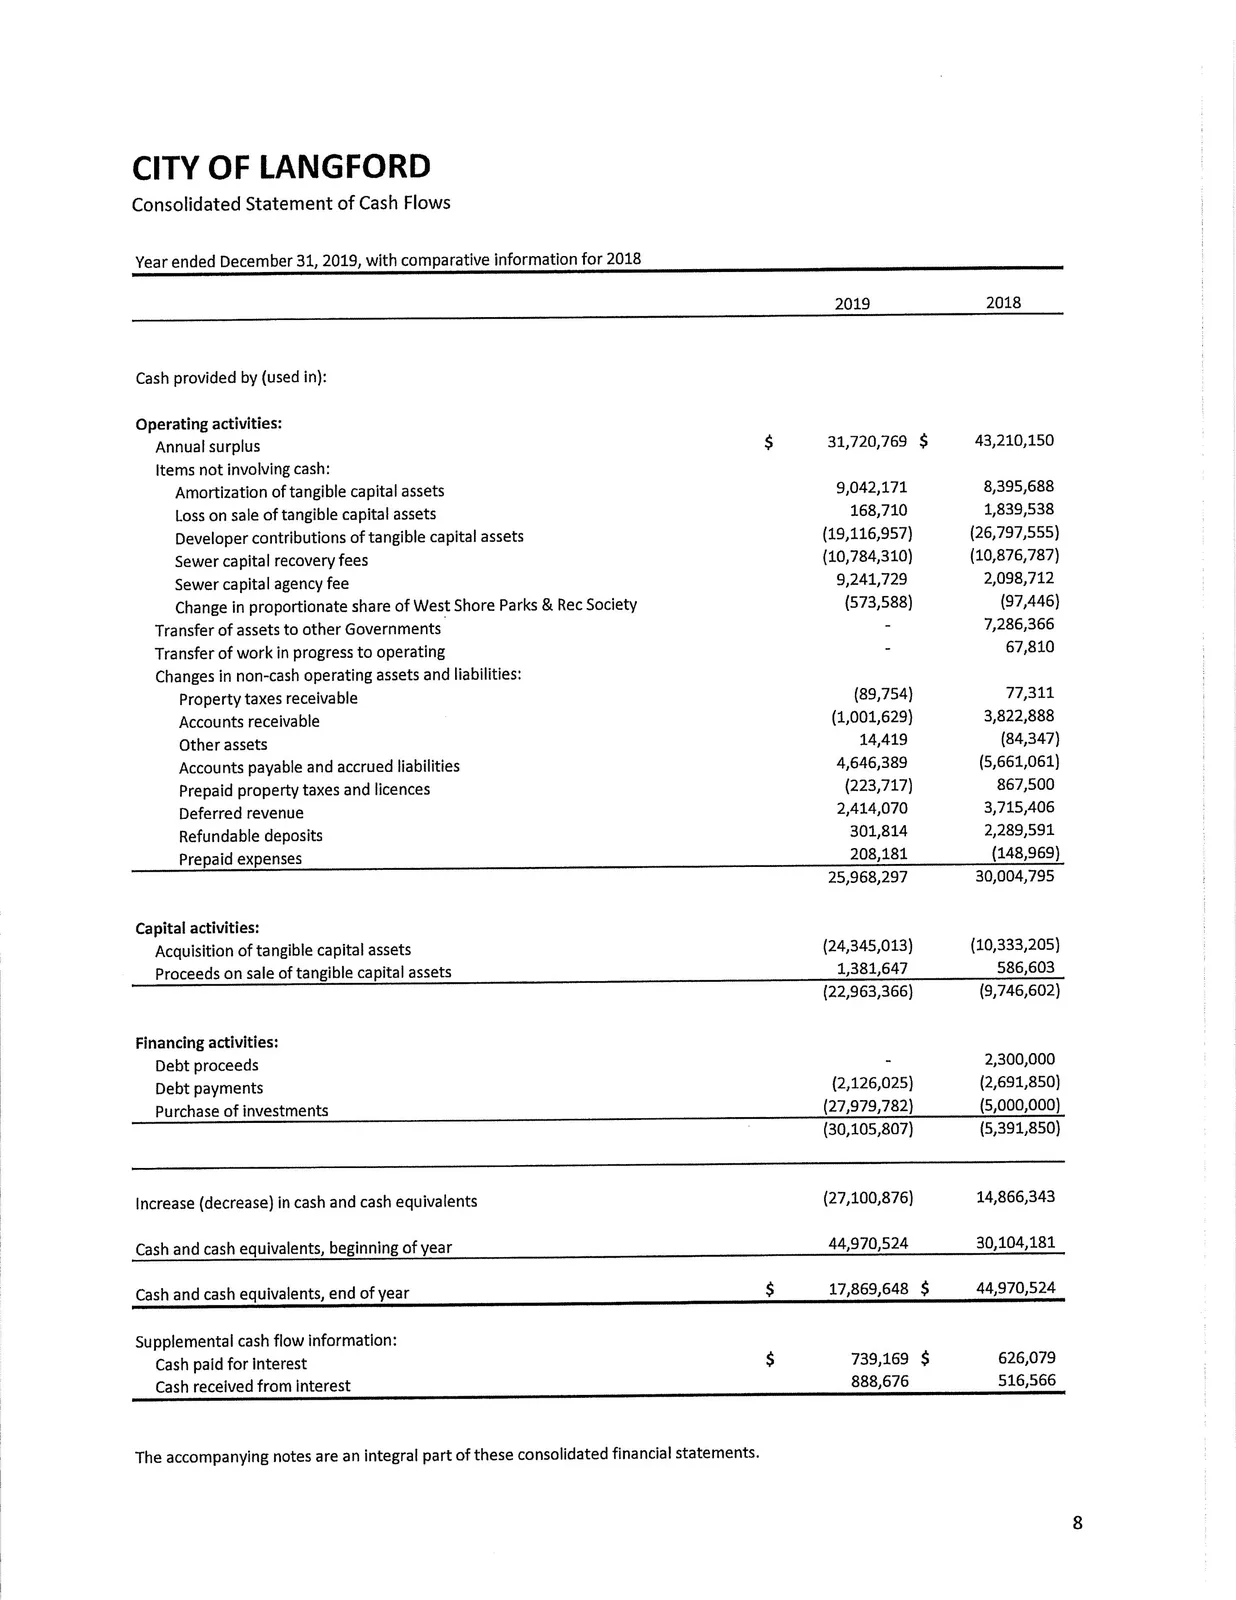
Consolidated Statement of Cash Flows
Year ended December 31, 2019 (comparatives for 2018)
| 2019 | 2018 | |
|---|---|---|
| Cash provided by (used in) Operating activities: | ||
| Annual surplus | $31,720,769 | $43,210,150 |
| Items not involving cash: | ||
| Amortization of tangible capital assets | 9,042,171 | 8,395,688 |
| Loss on sale of tangible capital assets | 168,710 | 1,839,538 |
| Developer contributions of tangible capital assets | (19,116,957) | (26,797,555) |
| Sewer capital recovery fees | (10,784,310) | (10,876,787) |
| Sewer capital agency fee | 9,241,729 | 2,098,712 |
| Change in proportionate share of West Shore Parks & Rec Society | (573,588) | (97,446) |
| Transfer of assets to other Governments | 7,286,366 | |
| Transfer of work in progress to operating | 67,810 | |
| Changes in non-cash operating assets and liabilities: | ||
| Property taxes receivable | (89,754) | 77,311 |
| Accounts receivable | (1,001,629) | 3,822,888 |
| Other assets | 14,419 | (84,347) |
| Accounts payable and accrued liabilities | 4,646,389 | (5,661,061) |
| Prepaid property taxes and licences | (223,717) | 867,500 |
| Deferred revenue | 2,414,070 | 3,715,406 |
| Refundable deposits | 301,814 | 2,289,591 |
| Prepaid expenses | 208,181 | (148,969) |
| Net cash provided by operating activities | 25,968,297 | 30,004,795 |
| Capital activities: | ||
| Acquisition of tangible capital assets | (24,345,013) | (10,333,205) |
| Proceeds on sale of tangible capital assets | 1,381,647 | 586,603 |
| Net cash used in capital activities | (22,963,366) | (9,746,602) |
| Financing activities: | ||
| Debt proceeds | 2,300,000 | |
| Debt payments | (2,126,025) | (2,691,850) |
| Purchase of investments | (27,979,782) | (5,000,000) |
| Net cash used in financing activities | (30,105,807) | (5,391,850) |
| Increase (decrease) in cash and cash equivalents | (27,100,876) | 14,866,343 |
| Cash and cash equivalents, beginning of year | 44,970,524 | 30,104,181 |
| Cash and cash equivalents, end of year | $17,869,648 | $44,970,524 |
| Supplemental cash flow information: | ||
| Cash paid for interest | $739,169 | $626,079 |
| Cash received from interest | $888,676 | $516,566 |
Notes to Consolidated Financial Statements
Year ended December 31, 2019
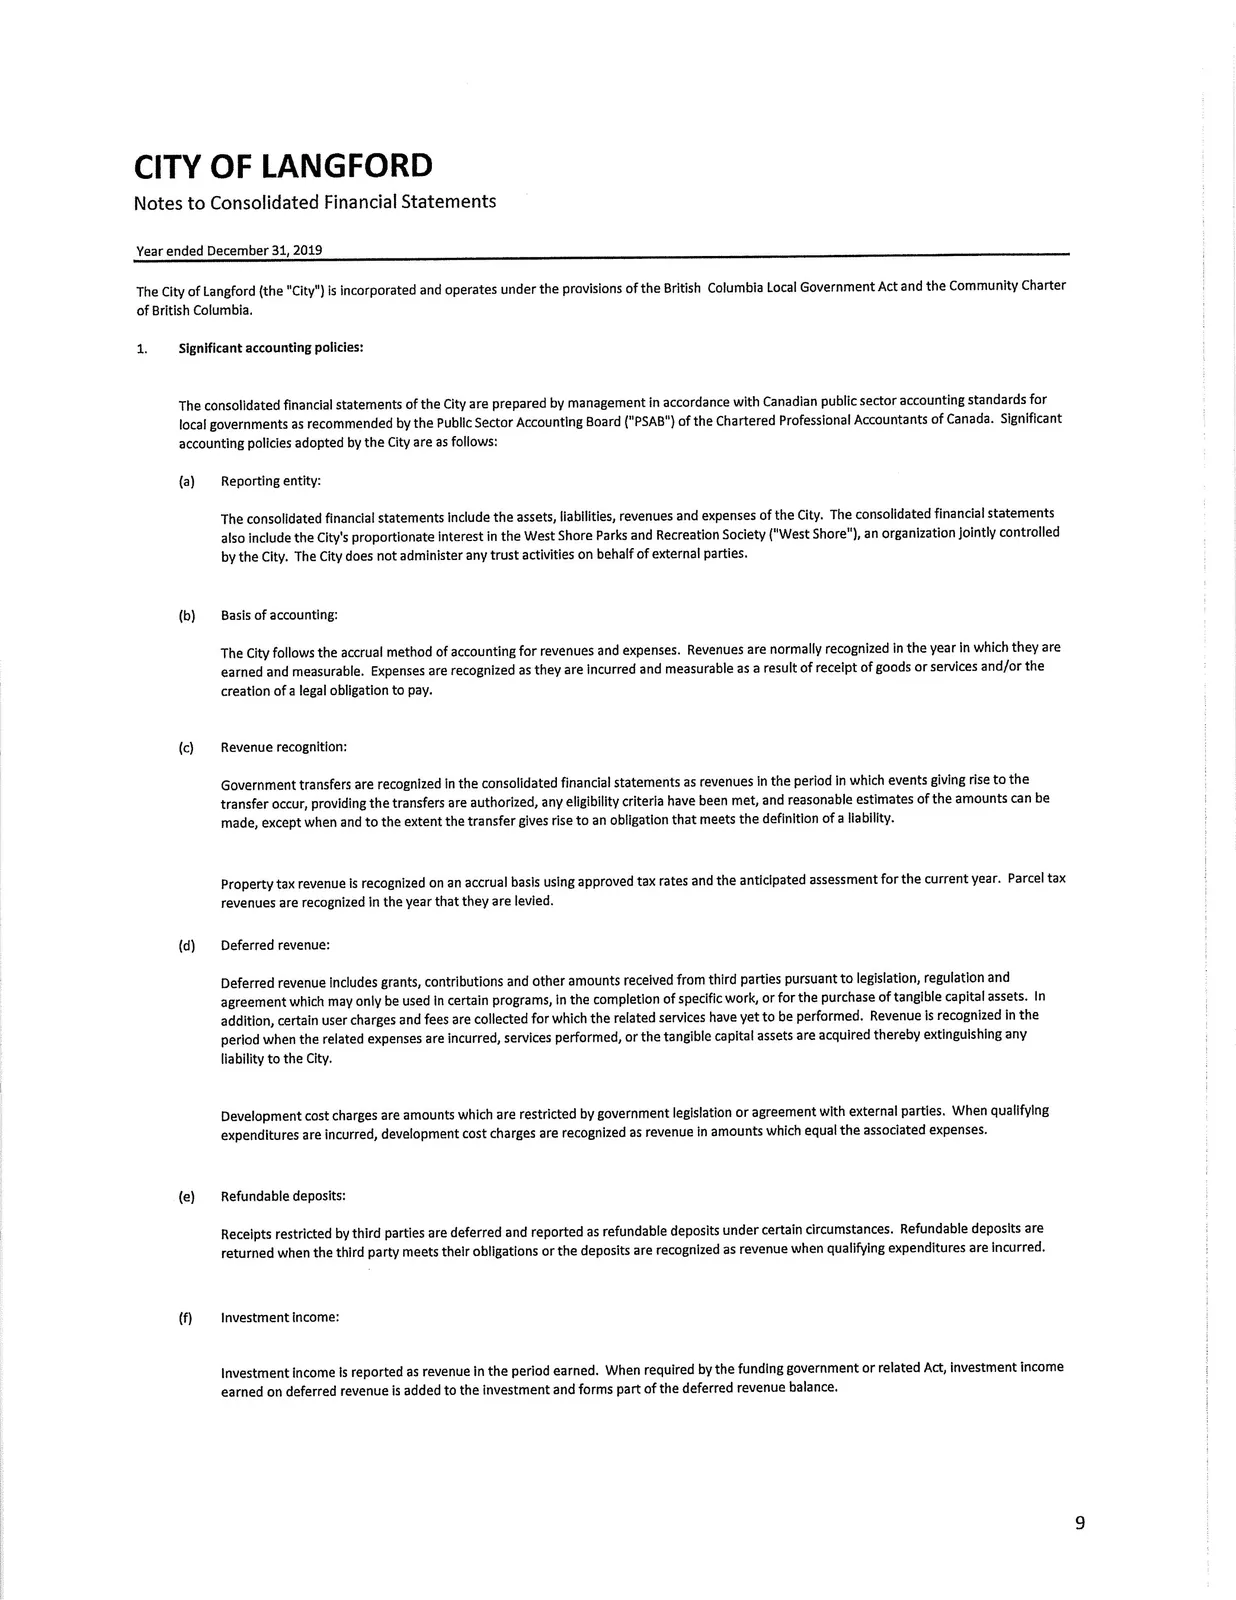
1. Significant accounting policies
The consolidated financial statements of the City are prepared by management in accordance with Canadian public sector accounting standards for local governments as recommended by the Public Sector Accounting Board ("PSAB") of the Chartered Professional Accountants of Canada. Significant accounting policies include:
(a) Reporting entity
- The consolidated financial statements include the assets, liabilities, revenues and expenses of the City and the City's proportionate interest in the West Shore Parks and Recreation Society ("West Shore"), an organization jointly controlled by the City.
(b) Basis of accounting
- The City follows the accrual method of accounting for revenues and expenses.
(c) Revenue recognition
- Government transfers recognized when events giving rise to transfer occur and eligibility criteria met. Property tax revenue recognized on an accrual basis using approved tax rates and anticipated assessment.
(d) Deferred revenue
- Includes grants, contributions and other amounts received from third parties which may only be used in certain programs or for specific work or tangible capital assets. Development cost charges are restricted amounts recognized as revenue when qualifying expenditures are incurred.
(e) Refundable deposits
- Receipts restricted by third parties are deferred and reported as refundable deposits and returned when obligations are met or recognized as revenue when qualifying expenditures are incurred.
(f) Investment income
- Reported as revenue in the period earned.
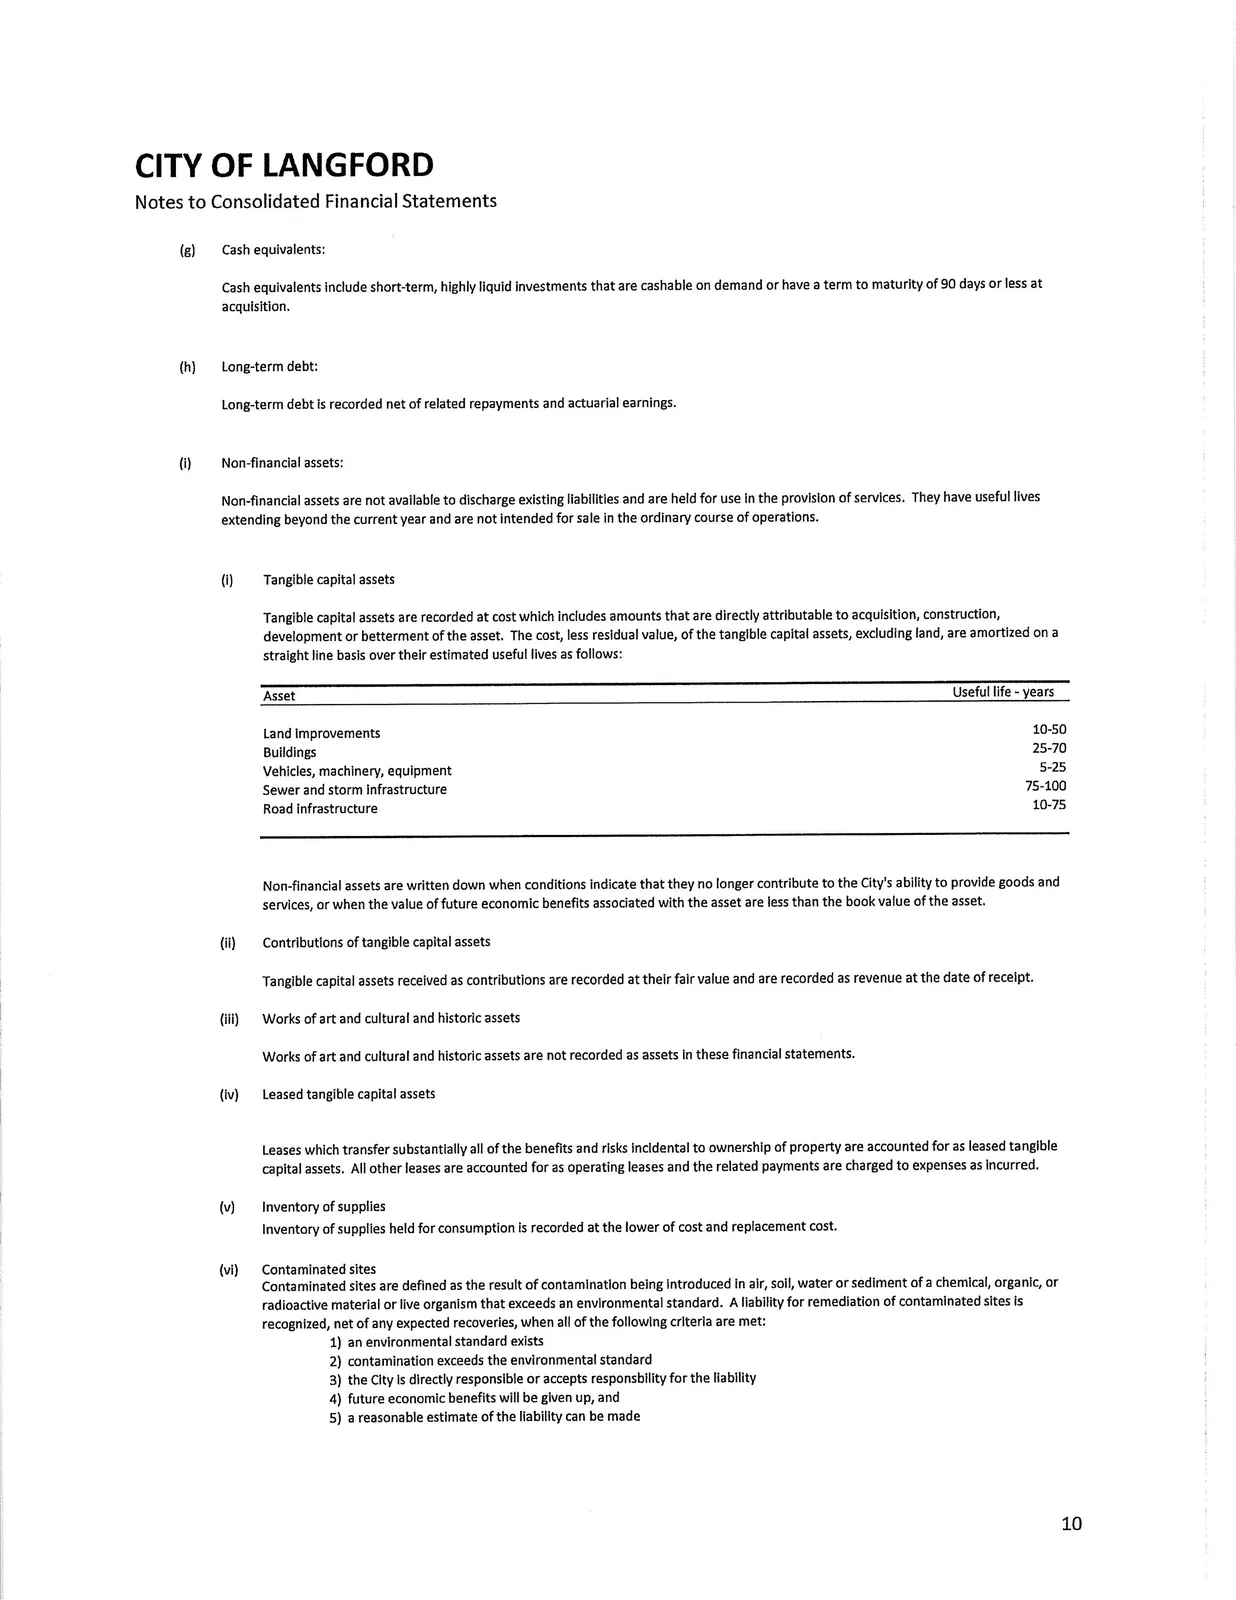
(g) Cash equivalents
- Short-term, highly liquid investments with term to maturity of 90 days or less at acquisition.
(h) Long-term debt
- Recorded net of related repayments and actuarial earnings.
(i) Non-financial assets
Held for use in the provision of services; include tangible capital assets, which are recorded at cost and amortized on a straight-line basis over estimated useful lives. Works of art and cultural/historical assets are not recorded.
Useful life ranges:
- Land improvements: 10–50 years
- Buildings: 25–70 years
- Vehicles, machinery, equipment: 5–25 years
- Sewer and storm infrastructure: 75–100 years
- Road infrastructure: 10–75 years
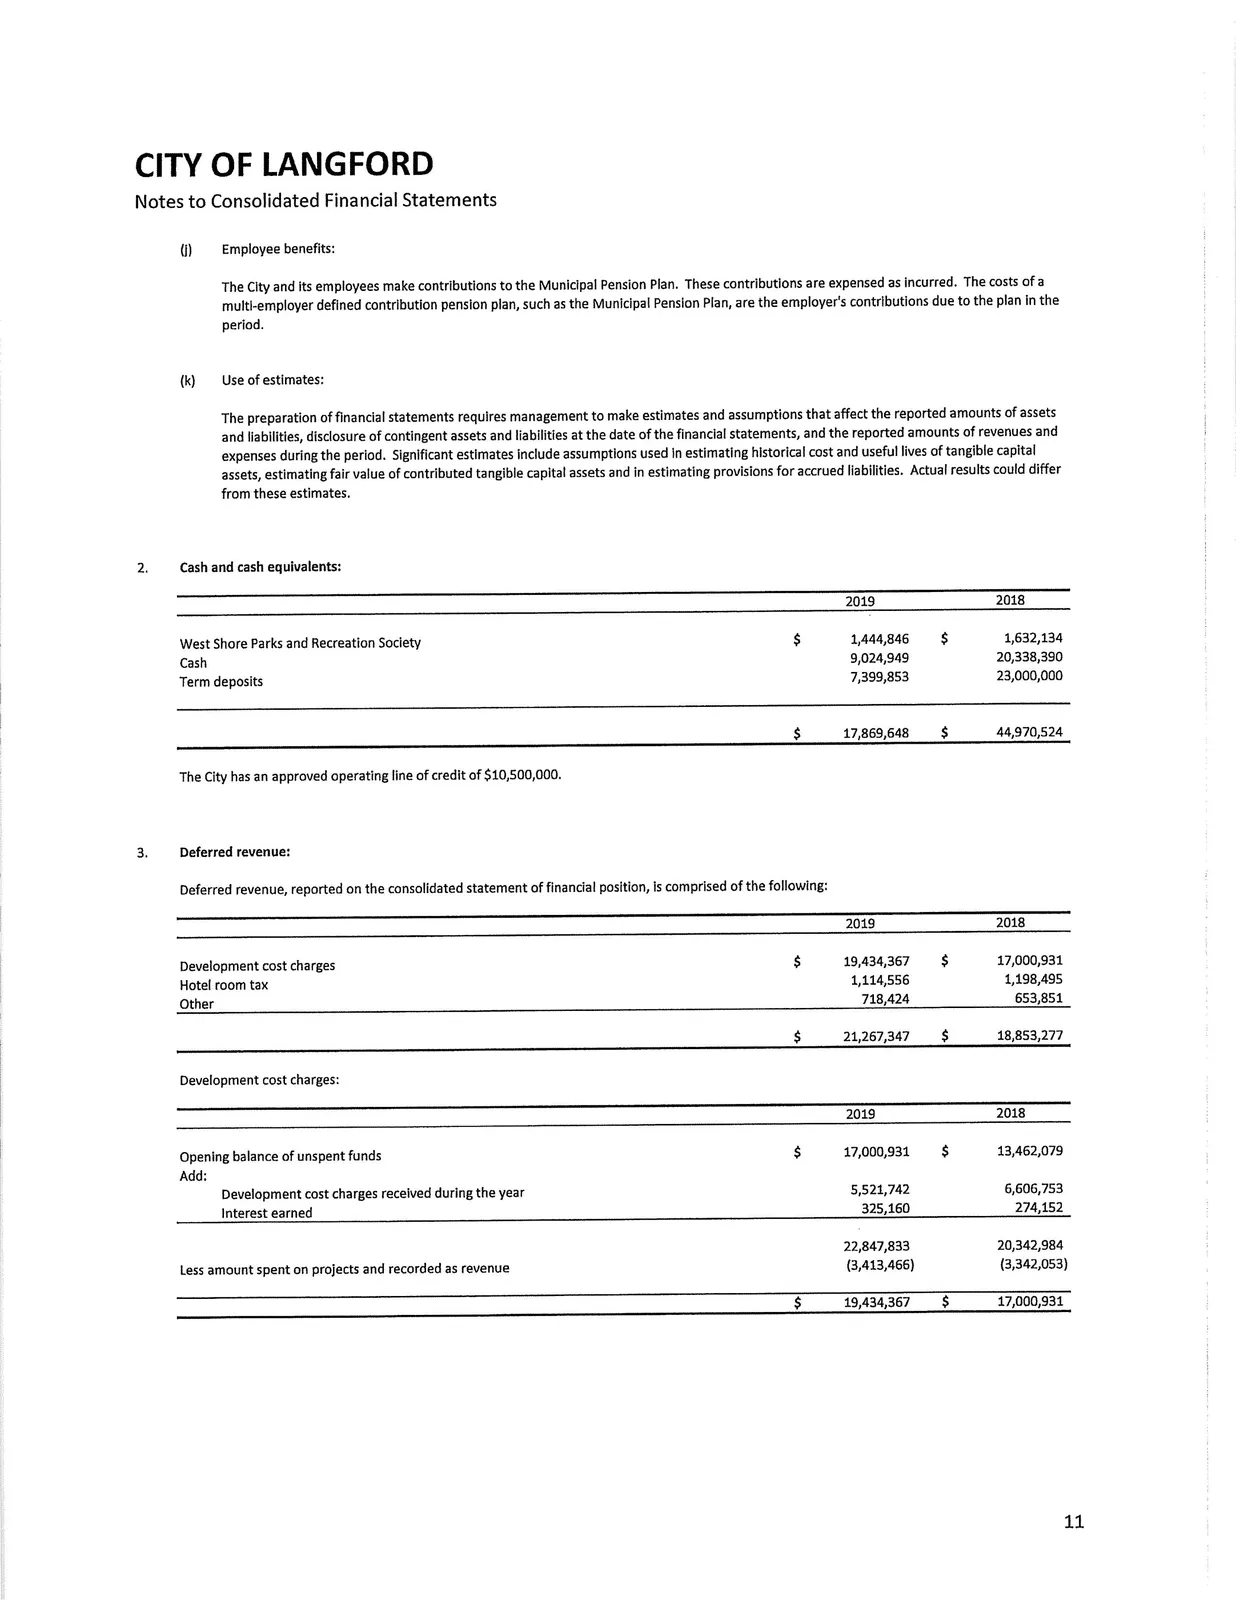
(j) Employee benefits
- The City and employees contribute to the Municipal Pension Plan. Contributions expensed as incurred.
(k) Use of estimates
- Management makes estimates and assumptions affecting amounts reported.
2. Cash and cash equivalents
2019:
- West Shore Parks and Recreation Society: $1,444,846
- Cash: $9,024,949
- Term deposits: $7,399,853
Total: $17,869,648
2018:
- West Shore Parks and Recreation Society: $1,632,134
- Cash: $20,338,390
- Term deposits: $23,000,000
Total: $44,970,524
The City has an approved operating line of credit of $10,500,000.
3. Deferred revenue
Deferred revenue comprises:
- 2019: Development cost charges $19,434,367; Hotel room tax $1,114,556; Other $718,424 — Total $21,267,347
- 2018: Development cost charges $17,000,931; Hotel room tax $1,198,495; Other $653,851 — Total $18,853,277
Development cost charges activity (2019):
- Opening balance of unspent funds: $17,000,931
- Add: Development cost charges received during the year: $5,521,742; Interest earned: $325,160
- Less amount spent on projects and recorded as revenue: $(3,413,466)
- Closing balance: $19,434,367
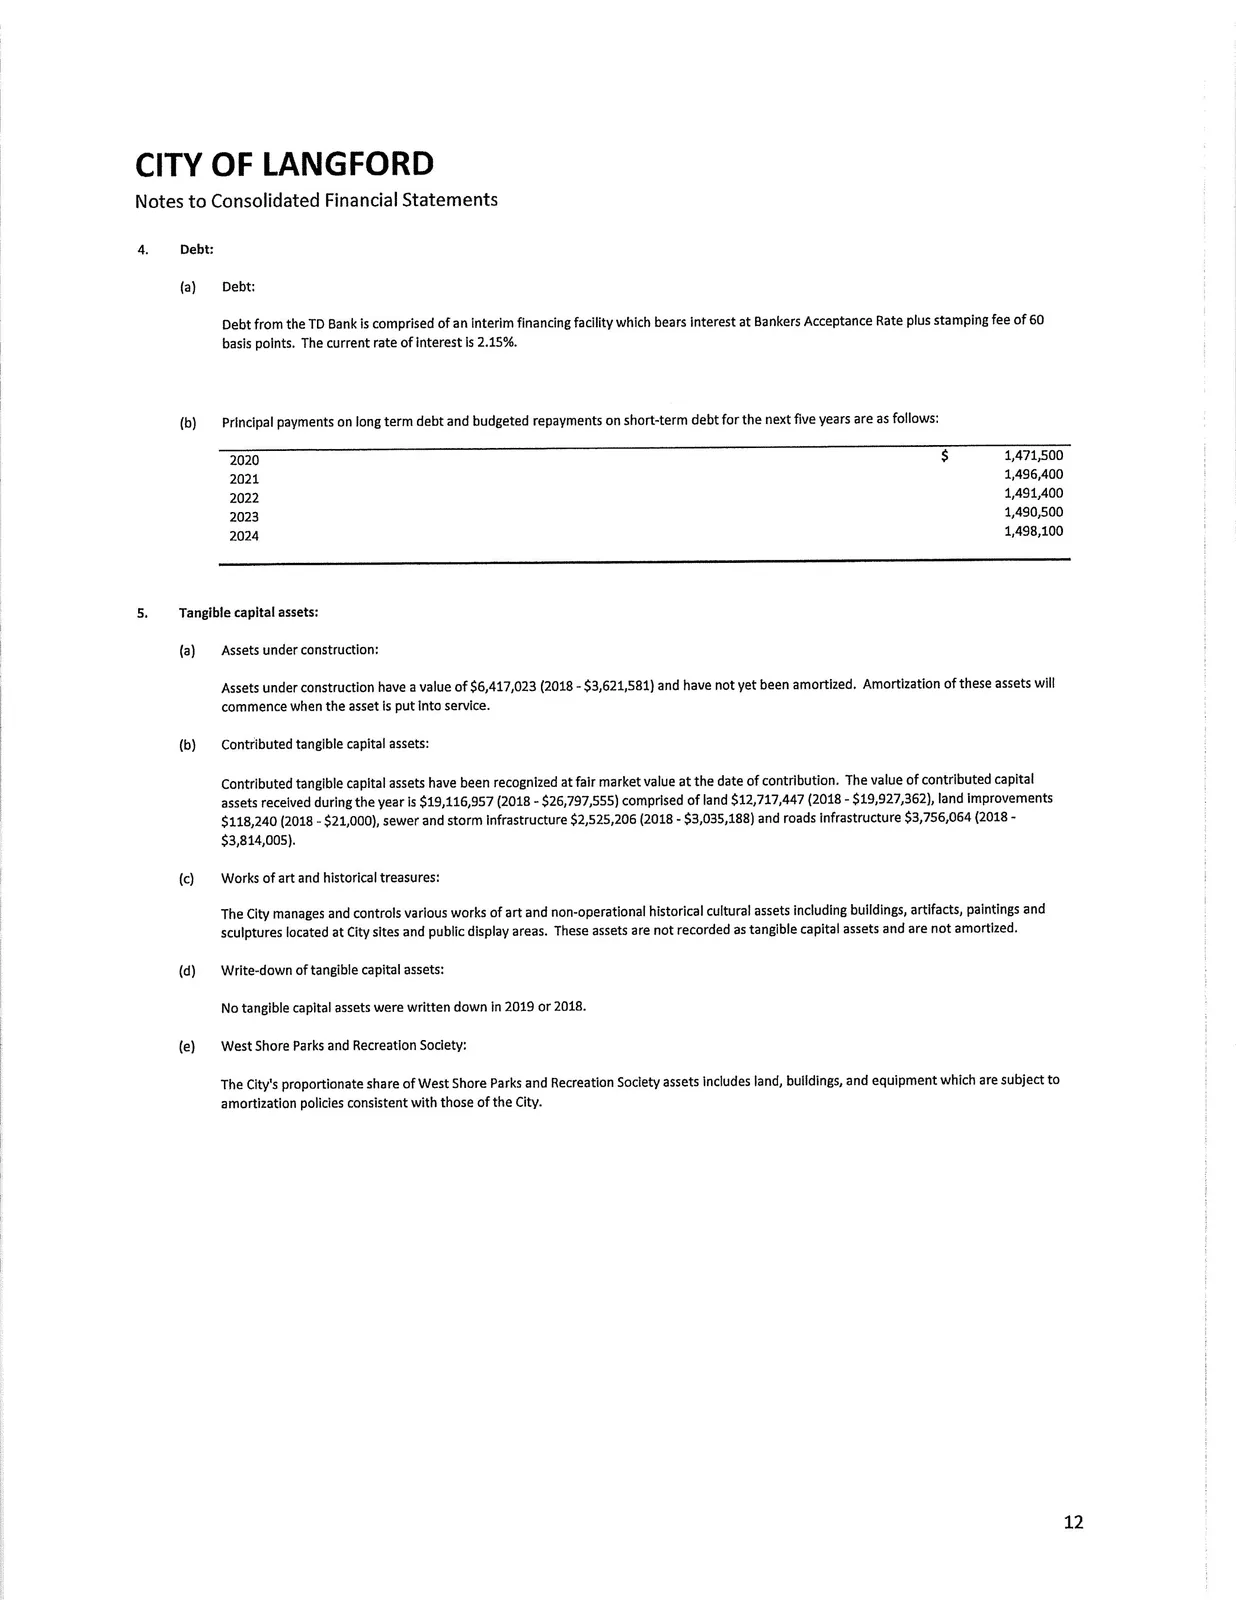
4. Debt
(a) Debt consists of an interim financing facility from TD Bank bearing interest at Bankers Acceptance Rate plus stamping fee of 60 basis points. Current rate 2.15%.
(b) Principal payments on long term debt and budgeted repayments on short-term debt for the next five years:
- 2020: 1,471,500
- 2021: 1,496,400
- 2022: 1,491,400
- 2023: 1,490,500
- 2024: 1,498,100
5. Tangible capital assets
(a) Assets under construction: $6,417,023 (2018 - $3,621,581) — not amortized until placed in service.
(b) Contributed tangible capital assets recognized at fair market value: total contributions in 2019 $19,116,957 (2018 - $26,797,555), comprised of:
- Land: $12,717,447 (2018 - $19,927,362)
- Land improvements: $118,240 (2018 - $21,000)
- Sewer & storm infrastructure: $2,525,206 (2018 - $3,035,188)
- Roads infrastructure: $3,756,064 (2018 - $3,814,005)
(c) Works of art and historical treasures are not recorded as tangible capital assets.
(d) No write-downs of tangible capital assets in 2019 or 2018.
(e) West Shore Parks and Recreation Society assets are included proportionately.
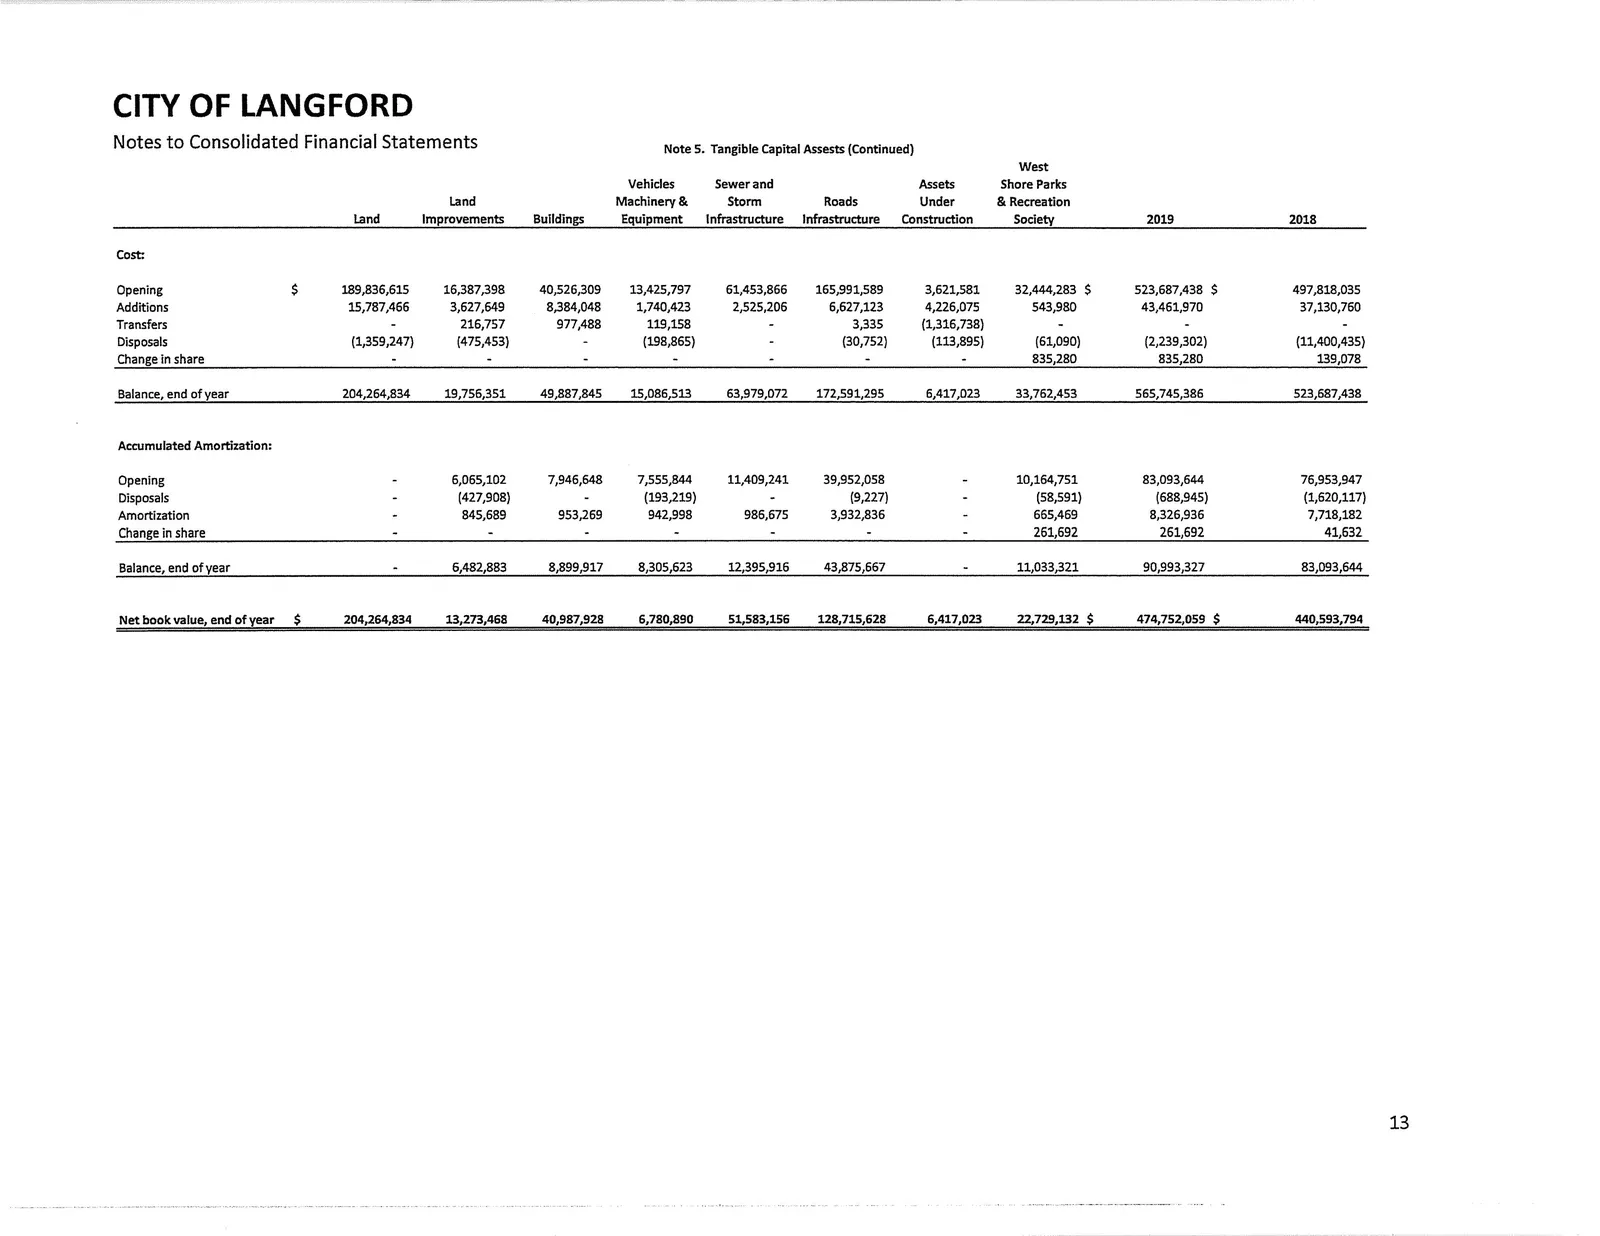
Note 5 — Summary of tangible capital asset cost, accumulated amortization and net book value (2019 vs 2018):
| Asset | Net book value, end of 2019 | Net book value, end of 2018 |
|---|---|---|
| Land | $204,264,834 | (opening cost shown) |
| Land Improvements | 13,273,468 | 16,440,750 (cost & totals reflected in full schedule) |
| Buildings | 40,987,928 | 32,970,465 |
| Vehicles, Machinery & Equipment | 6,780,890 | 2,016,556 |
| Sewer and Storm Infrastructure | 51,583,156 | 25,999,531 |
| Roads Infrastructure | 128,715,628 | 126,039,238 |
| Assets Under Construction | 6,417,023 | 3,621,581 |
| West Shore Parks & Recreation Society (net) | 22,729,132 | 33,762,453 |
| Total tangible capital assets (net) | $474,752,059 | $440,593,794 |
(See note 5 for full cost and accumulated amortization tables.)
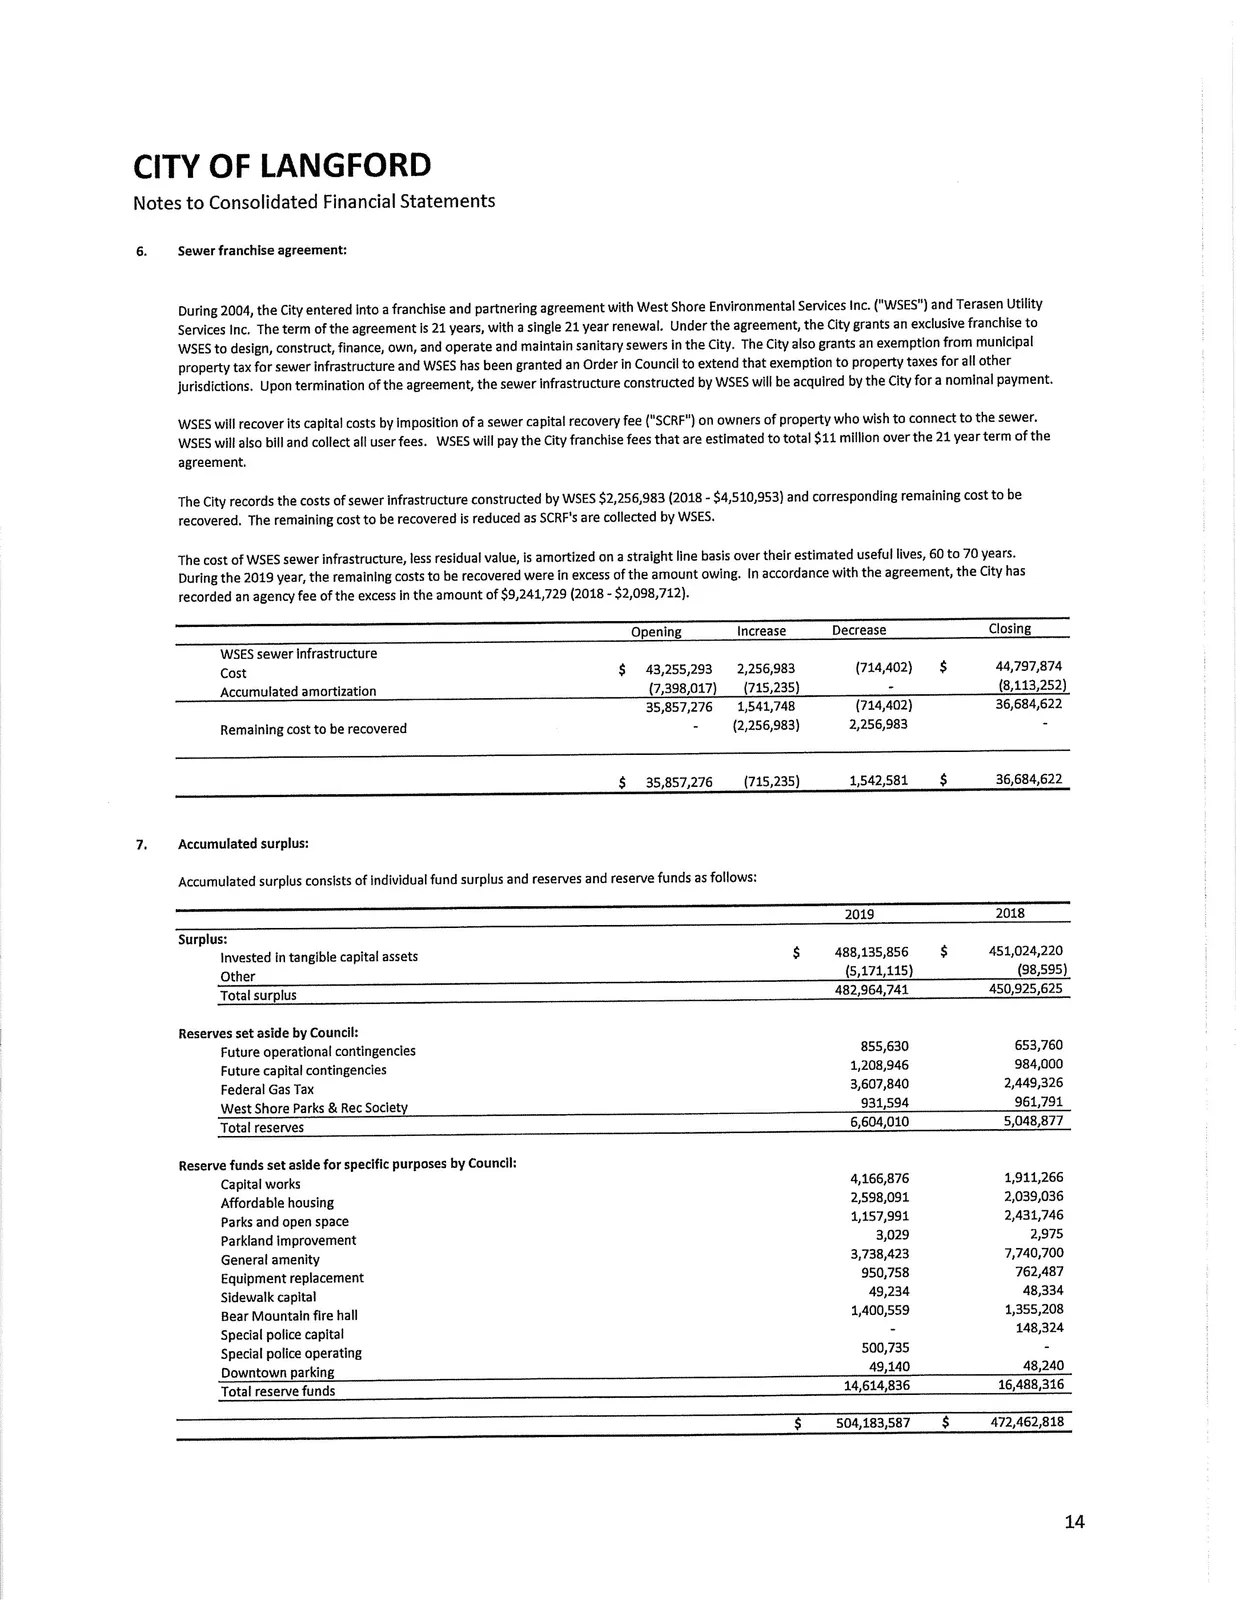
6. Sewer franchise agreement
- In 2004 the City entered a 21-year franchise and partnering agreement with West Shore Environmental Services Inc. ("WSES") and Terasen Utility Services Inc. for design, construction, financing, ownership and operation of sanitary sewers. Term includes single 21-year renewal.
- WSES recovers capital costs via Sewer Capital Recovery Fee (SCRF) on property owners who connect to the sewer. WSES bills and collects user fees and pays the City franchise fees estimated at $11 million over the 21-year term.
- The City records costs of sewer infrastructure constructed by WSES and corresponding remaining cost to be recovered. Remaining cost to be recovered reduced as SCRFs collected by WSES.
- During 2019 the remaining costs to be recovered were in excess of the amount owing. The City recorded an agency fee of the excess in the amount of $9,241,729 (2018 - $2,098,712).
Opening/closing balances for WSES sewer infrastructure (extract):
- WSES sewer Infrastructure Cost — Closing: $44,797,874
- Accumulated amortization — Closing: $(8,113,252)
- Net closing balance: $36,684,622
7. Accumulated surplus
Accumulated surplus consists of:
| Item | 2019 | 2018 |
|---|---|---|
| Surplus: Invested in tangible capital assets | $488,135,856 | $451,024,220 |
| Surplus: Other | (5,171,115) | (98,595) |
| Total surplus | 482,964,741 | 450,925,625 |
| Reserves set aside by Council (total) | 6,604,010 | 5,048,877 |
| Reserve funds set aside for specific purposes (total) | 14,614,836 | 16,488,316 |
| Accumulated surplus (total) | $504,183,587 | $472,462,818 |
Reserve fund examples include: Federal Gas Tax ($3,607,840), West Shore Parks & Rec Society ($931,594), Capital works ($4,166,876), Affordable housing ($2,598,091), General amenity ($3,738,423), Bear Mountain fire hall ($1,400,559), etc.
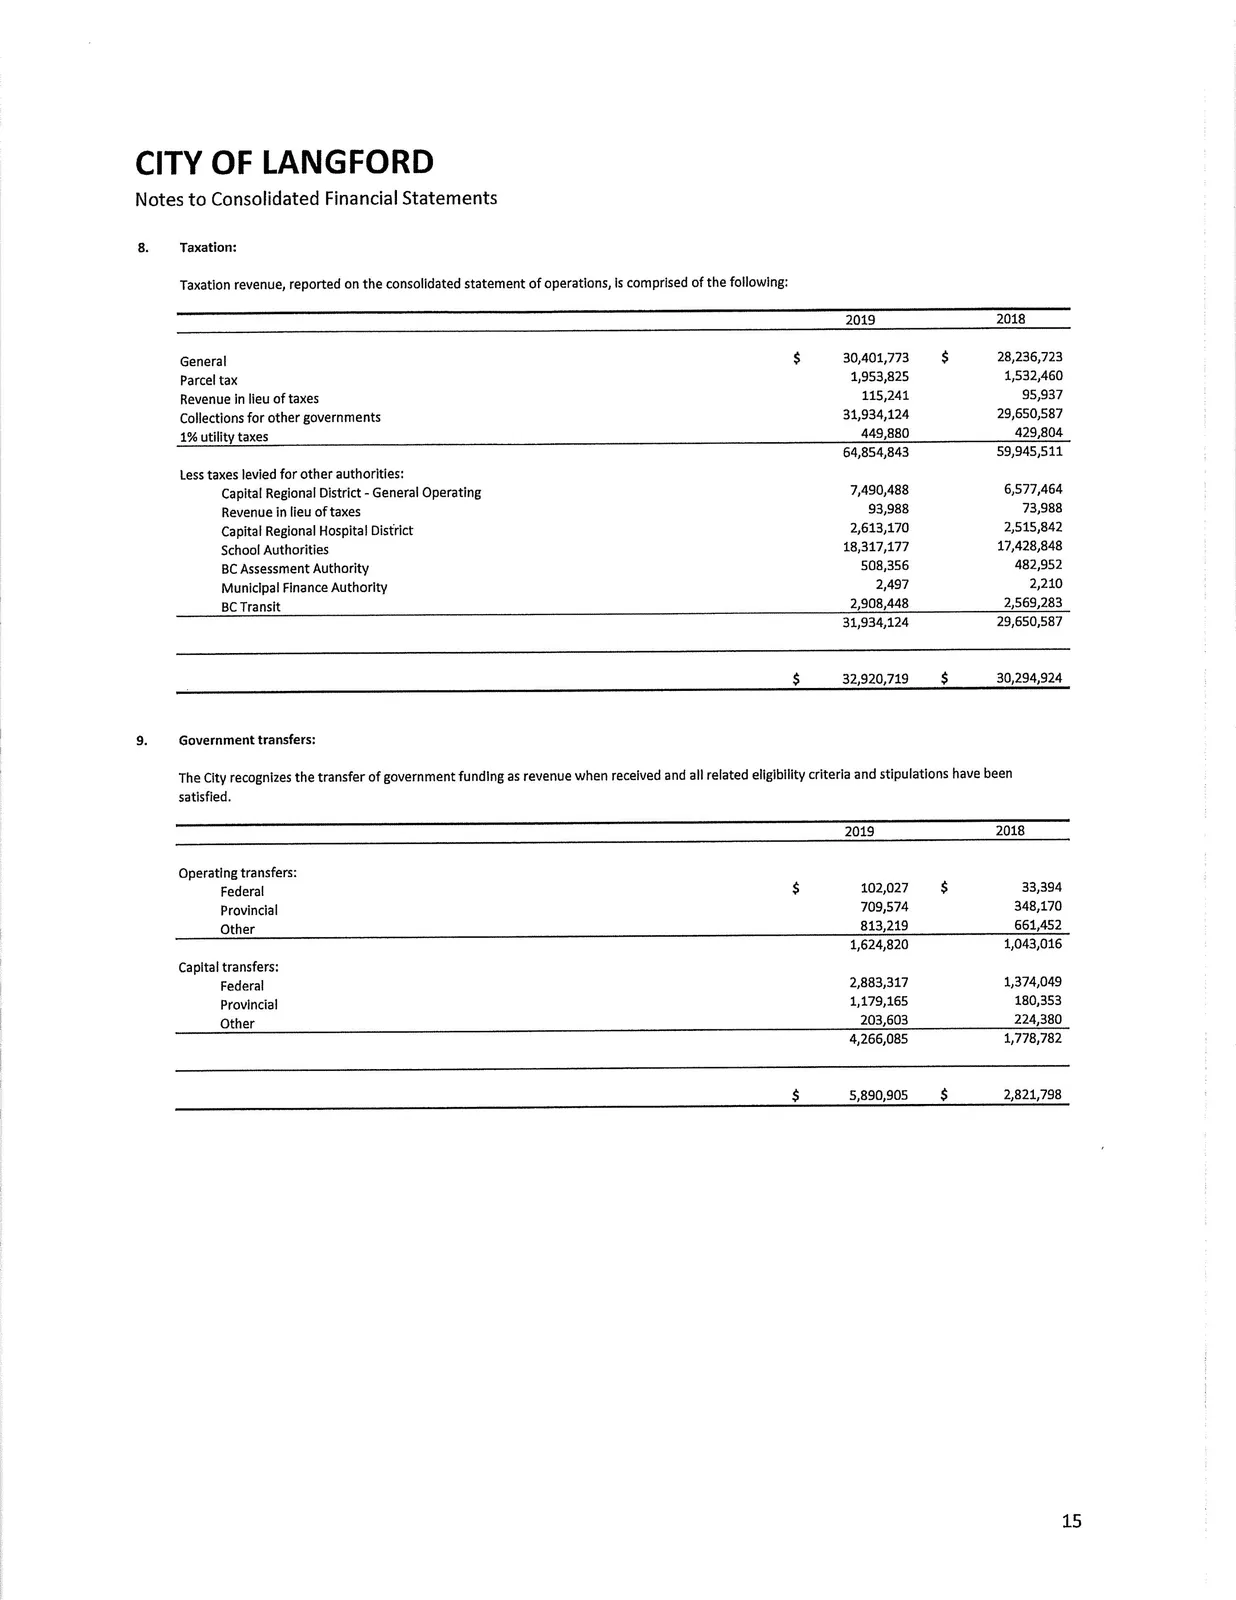
8. Taxation
Taxation revenue (2019 vs 2018):
| Item | 2019 | 2018 |
|---|---|---|
| General | 30,401,773 | 28,236,723 |
| Parcel tax | 1,953,825 | 1,532,460 |
| Revenue in lieu of taxes | 115,241 | 95,937 |
| Collections for other governments | 31,934,124 | 29,650,587 |
| 1% utility taxes | 449,880 | 429,804 |
| Total taxation (gross) | 64,854,843 | 59,945,511 |
Less taxes levied for other authorities (items such as CRD, Hospital District, School Authorities, BC Assessment Authority, BC Transit) — net taxation reported: 2019 $32,920,719 (2018 $30,294,924).
9. Government transfers
Government transfers recognized when eligibility criteria and stipulations satisfied.
2019 operating and capital transfers (summary):
- Operating transfers (Federal, Provincial, Other): $813,219 (2019); $1,624,820 (2018)
- Capital transfers (Federal, Provincial, Other): $4,266,085 (2019); $1,778,782 (2018)
- Total government transfers: $5,890,905 (2019); $2,821,798 (2018)
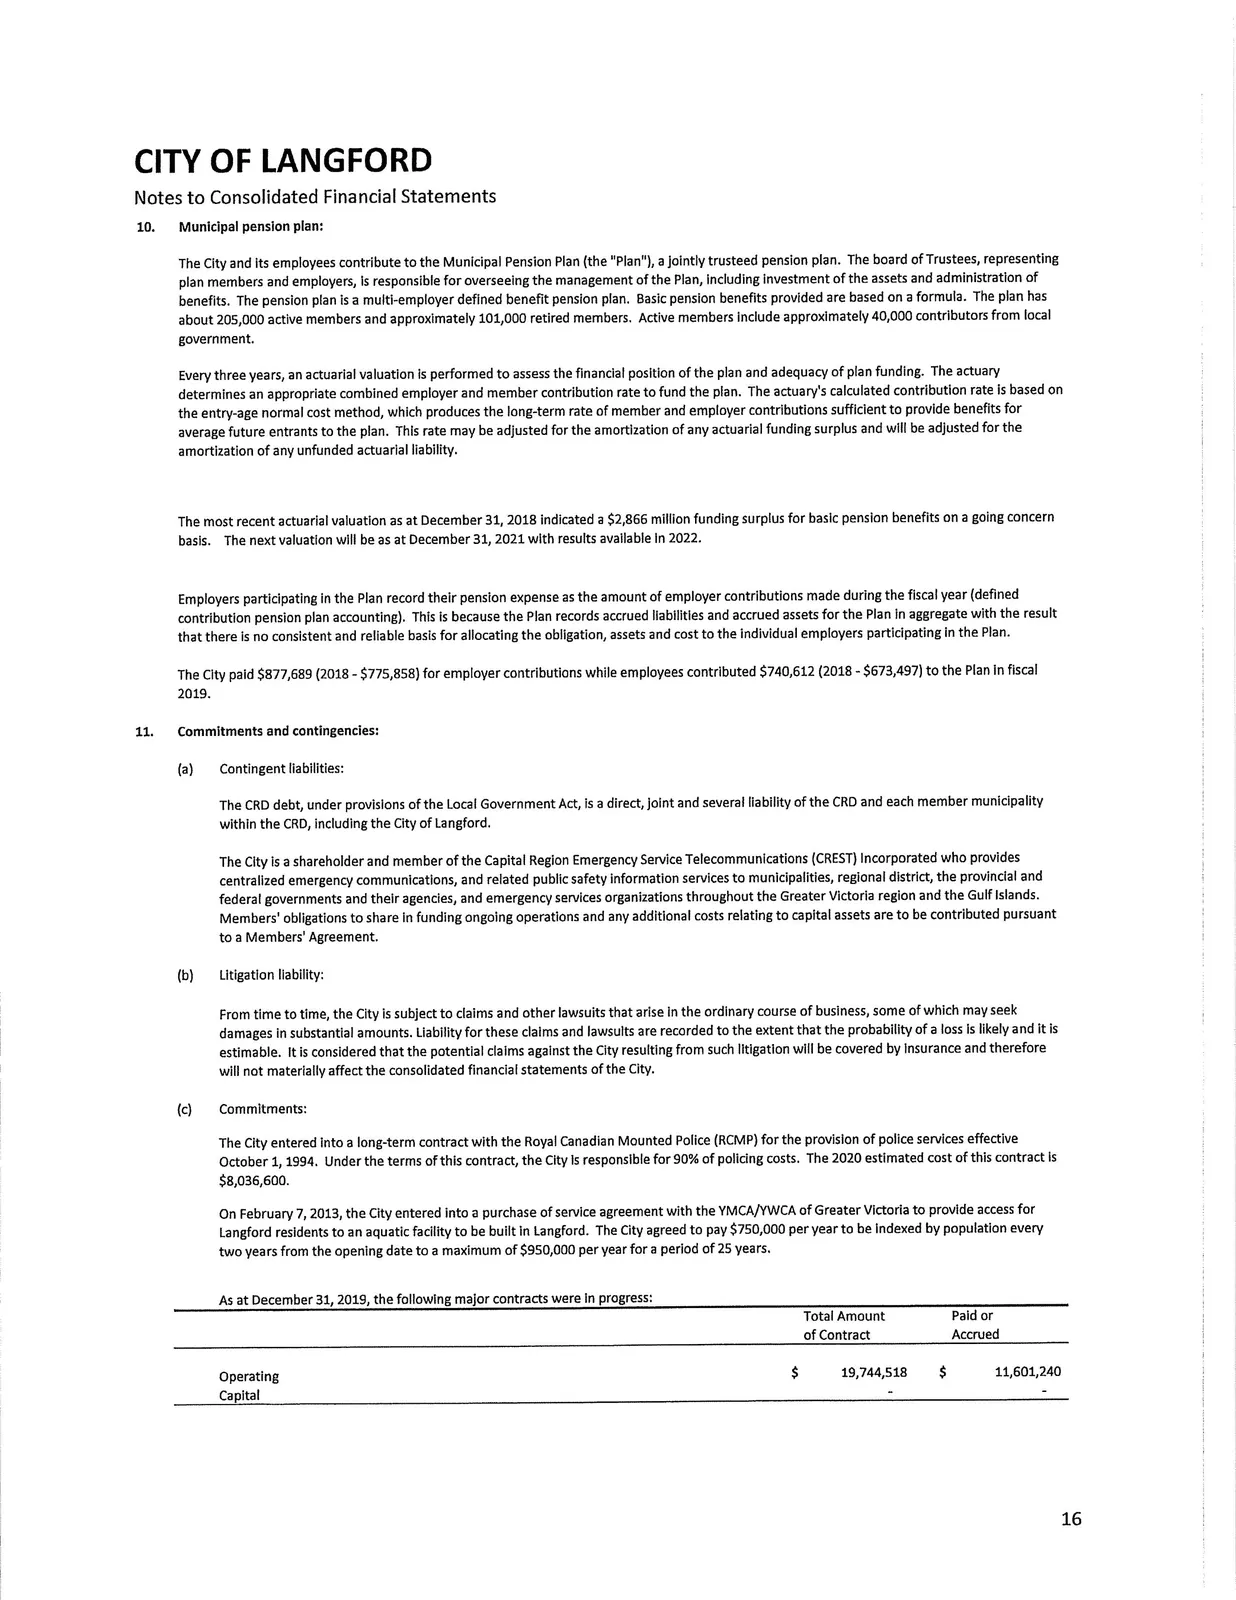
10. Municipal pension plan
- The City and its employees contribute to the Municipal Pension Plan (multi-employer defined benefit plan).
- The most recent actuarial valuation as at December 31, 2018 indicated a $2,866 million funding surplus for basic pension benefits on a going concern basis. Next valuation as at December 31, 2021.
- The City paid $877,689 (2018 - $775,858) in employer contributions; employees contributed $740,612 (2018 - $673,497) in 2019.
11. Commitments and contingencies
(a) Contingent liabilities: CRD debt is a direct, joint and several liability of CRD and member municipalities. City is a shareholder/member of CREST Inc. Members share in funding operations and capital assets per Members' Agreement.
(b) Litigation liability: From time to time subject to claims; potential claims expected to be covered by insurance and not materially affect consolidated financial statements.
(c) Commitments: Long-term RCMP contract effective October 1, 1994 — City responsible for 90% of policing costs. 2020 estimated cost: $8,036,600. Purchase of service agreement with YMCA/YWCA of Greater Victoria: City agreed to pay $750,000 per year indexed by population every two years up to $950,000 per year for 25 years. Major contracts in progress as at December 31, 2019 include Operating contracts total amount $19,744,518 (Paid or accrued $11,601,240); Capital contracts in progress (amounts not fully listed here).
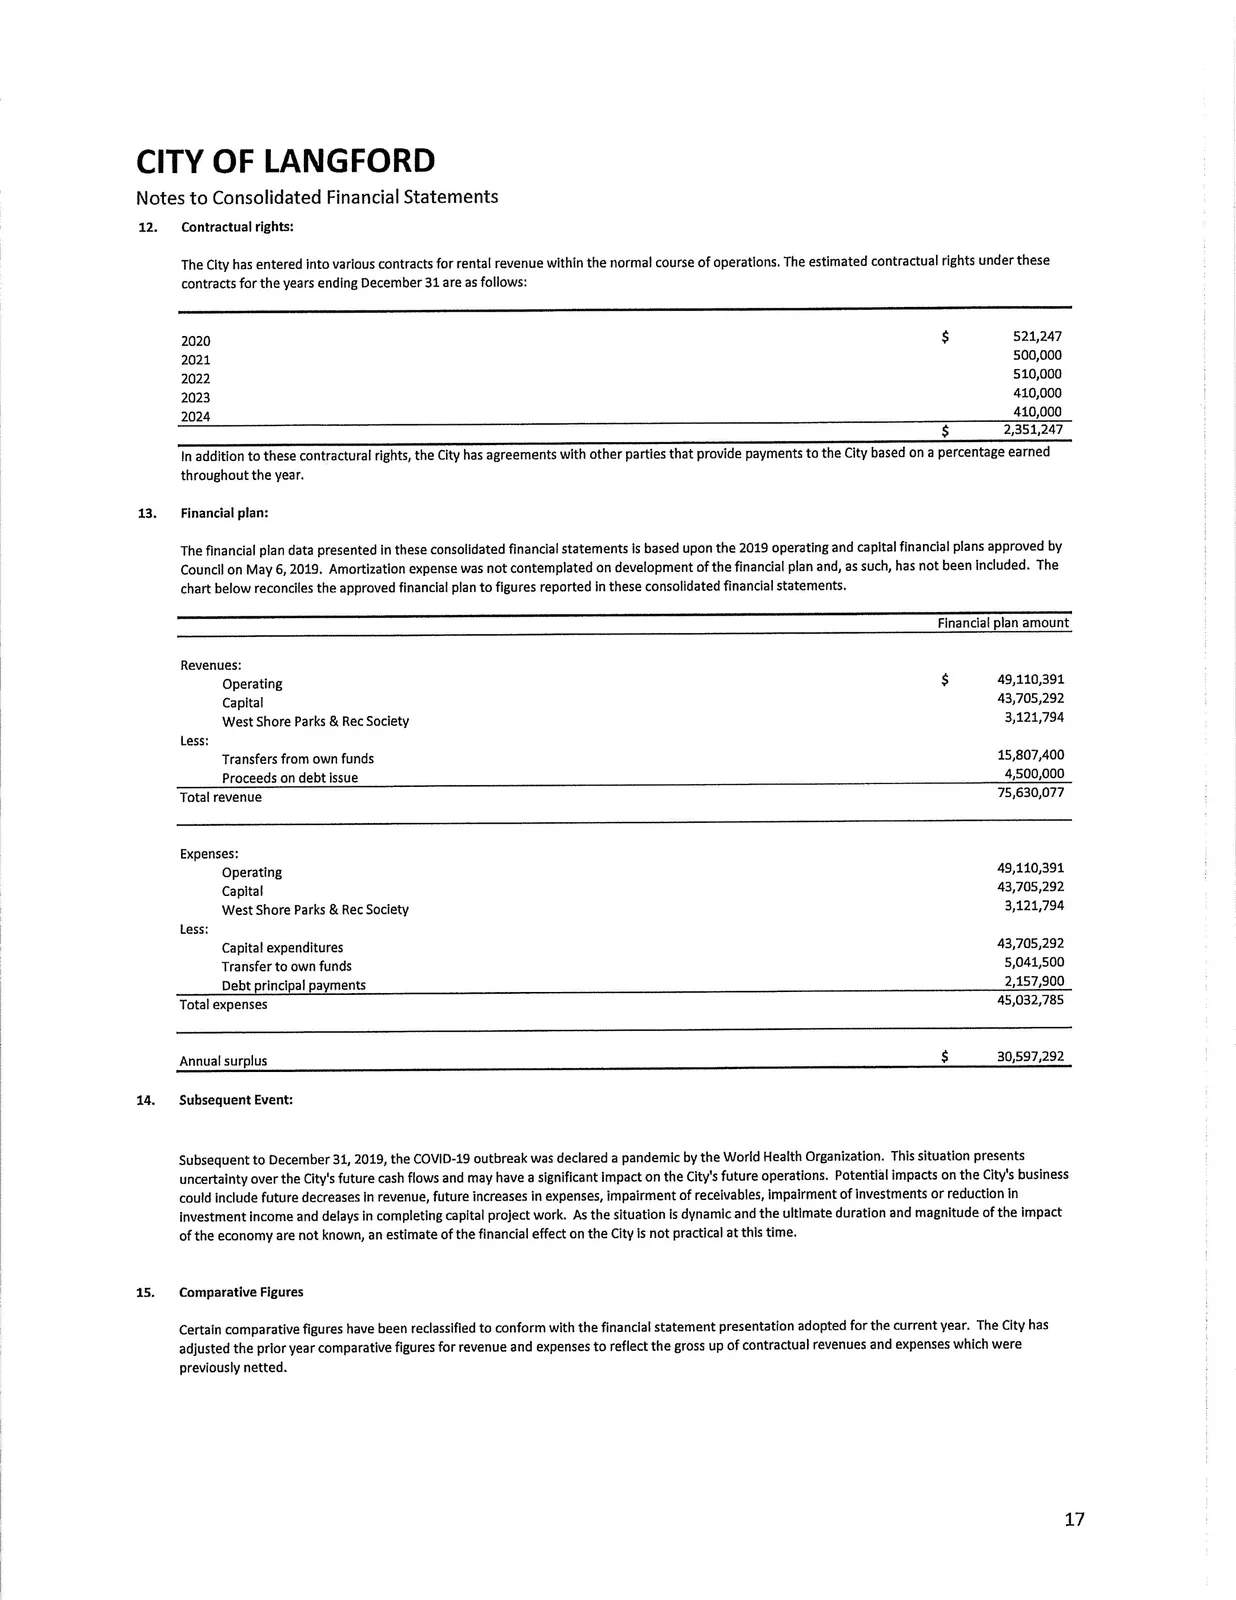
12. Contractual rights
Estimated contractual rights for rental revenue contracts:
| Year ending Dec 31 | Amount |
|---|---|
| 2020 | 521,247 |
| 2021 | 500,000 |
| 2022 | 510,000 |
| 2023 | 410,000 |
| 2024 | 410,000 |
| Total | 2,351,247 |
In addition, agreements exist that provide payments based on a percentage earned throughout the year.
13. Financial plan
- The financial plan data is based on the 2019 operating and capital financial plans approved by Council on May 6, 2019. Amortization expense was not contemplated on development of the financial plan and has not been included. (See reconciliation in the notes.)
14. Subsequent Event
- Subsequent to December 31, 2019, the COVID-19 outbreak was declared a pandemic. This presents uncertainty over future cash flows and may have a significant impact on future operations (potential decreases in revenue, increases in expenses, impairment of receivables, investments, and delays in capital projects). An estimate of the financial effect is not practical at this time.
15. Comparative Figures
- Certain comparative figures have been reclassified to conform with the current year presentation. Prior year figures adjusted for gross up of contractual revenues and expenses which were previously netted.
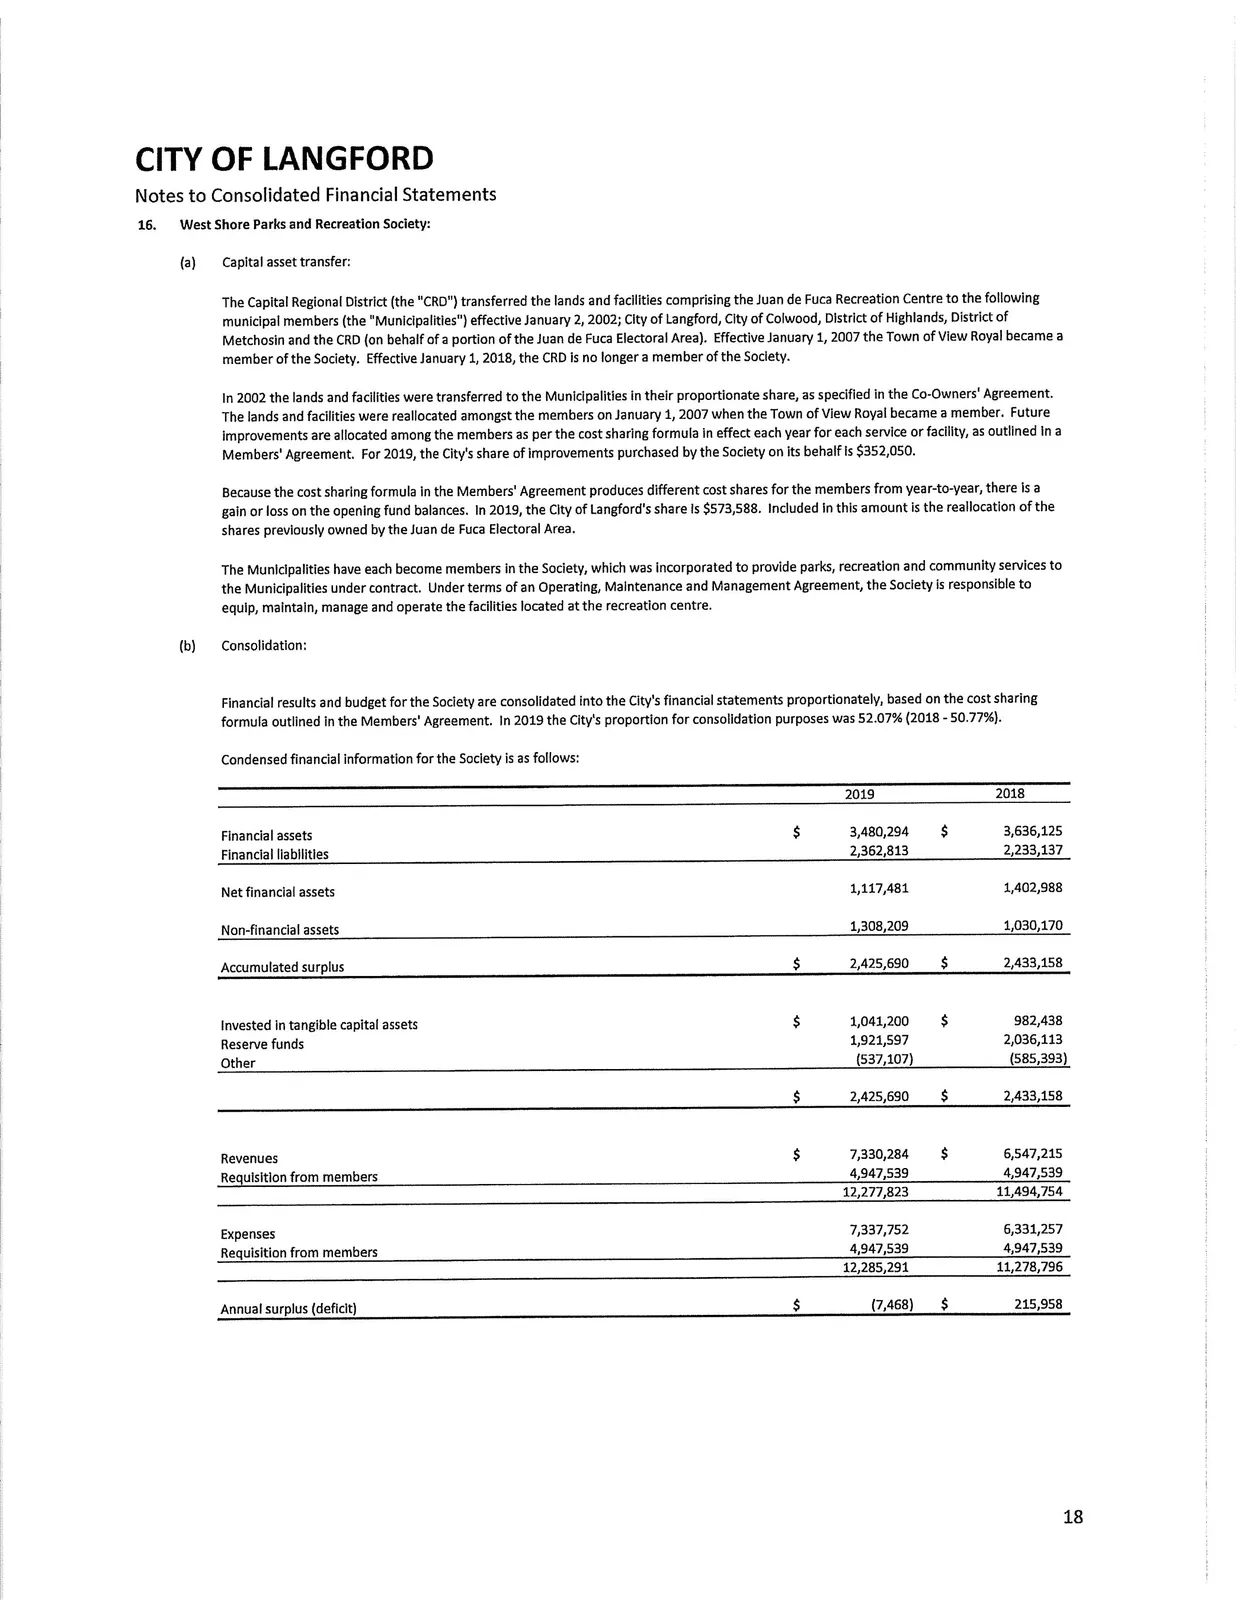
16. West Shore Parks and Recreation Society
(a) Capital asset transfer and membership history: Lands and facilities comprising Juan de Fuca Recreation Centre were transferred by the CRD to municipal members effective January 2, 2002. Town of View Royal became a member effective January 1, 2007. CRD is no longer a member effective January 1, 2018.
- For 2019, the City's share of improvements purchased by the Society on its behalf: $352,050.
- The City's share change (gain/loss on opening fund balances) for 2019: $573,588 (includes reallocation of Juan de Fuca Electoral Area shares).
(b) Consolidation: Financial results and budget for the Society are consolidated proportionately. City's proportion for 2019: 52.07% (2018: 50.77%).
Condensed financial information for the Society (2019 vs 2018):
| Item | 2019 | 2018 |
|---|---|---|
| Financial assets | 3,480,294 | 3,636,125 |
| Financial liabilities | 2,362,813 | 2,233,137 |
| Net financial assets | 1,117,481 | 1,402,988 |
| Non-financial assets | 1,308,209 | 1,030,170 |
| Accumulated surplus | 2,425,690 | 2,433,158 |
| Invested in tangible capital assets | 1,041,200 | 982,438 |
| Reserve funds | 1,921,597 | 2,036,113 |
| Other | (537,107) | (585,393) |
| Revenues | 12,277,823 | 11,494,754 |
| Expenses | 12,285,291 | 11,278,796 |
| Annual surplus (deficit) | (7,468) | 215,958 |
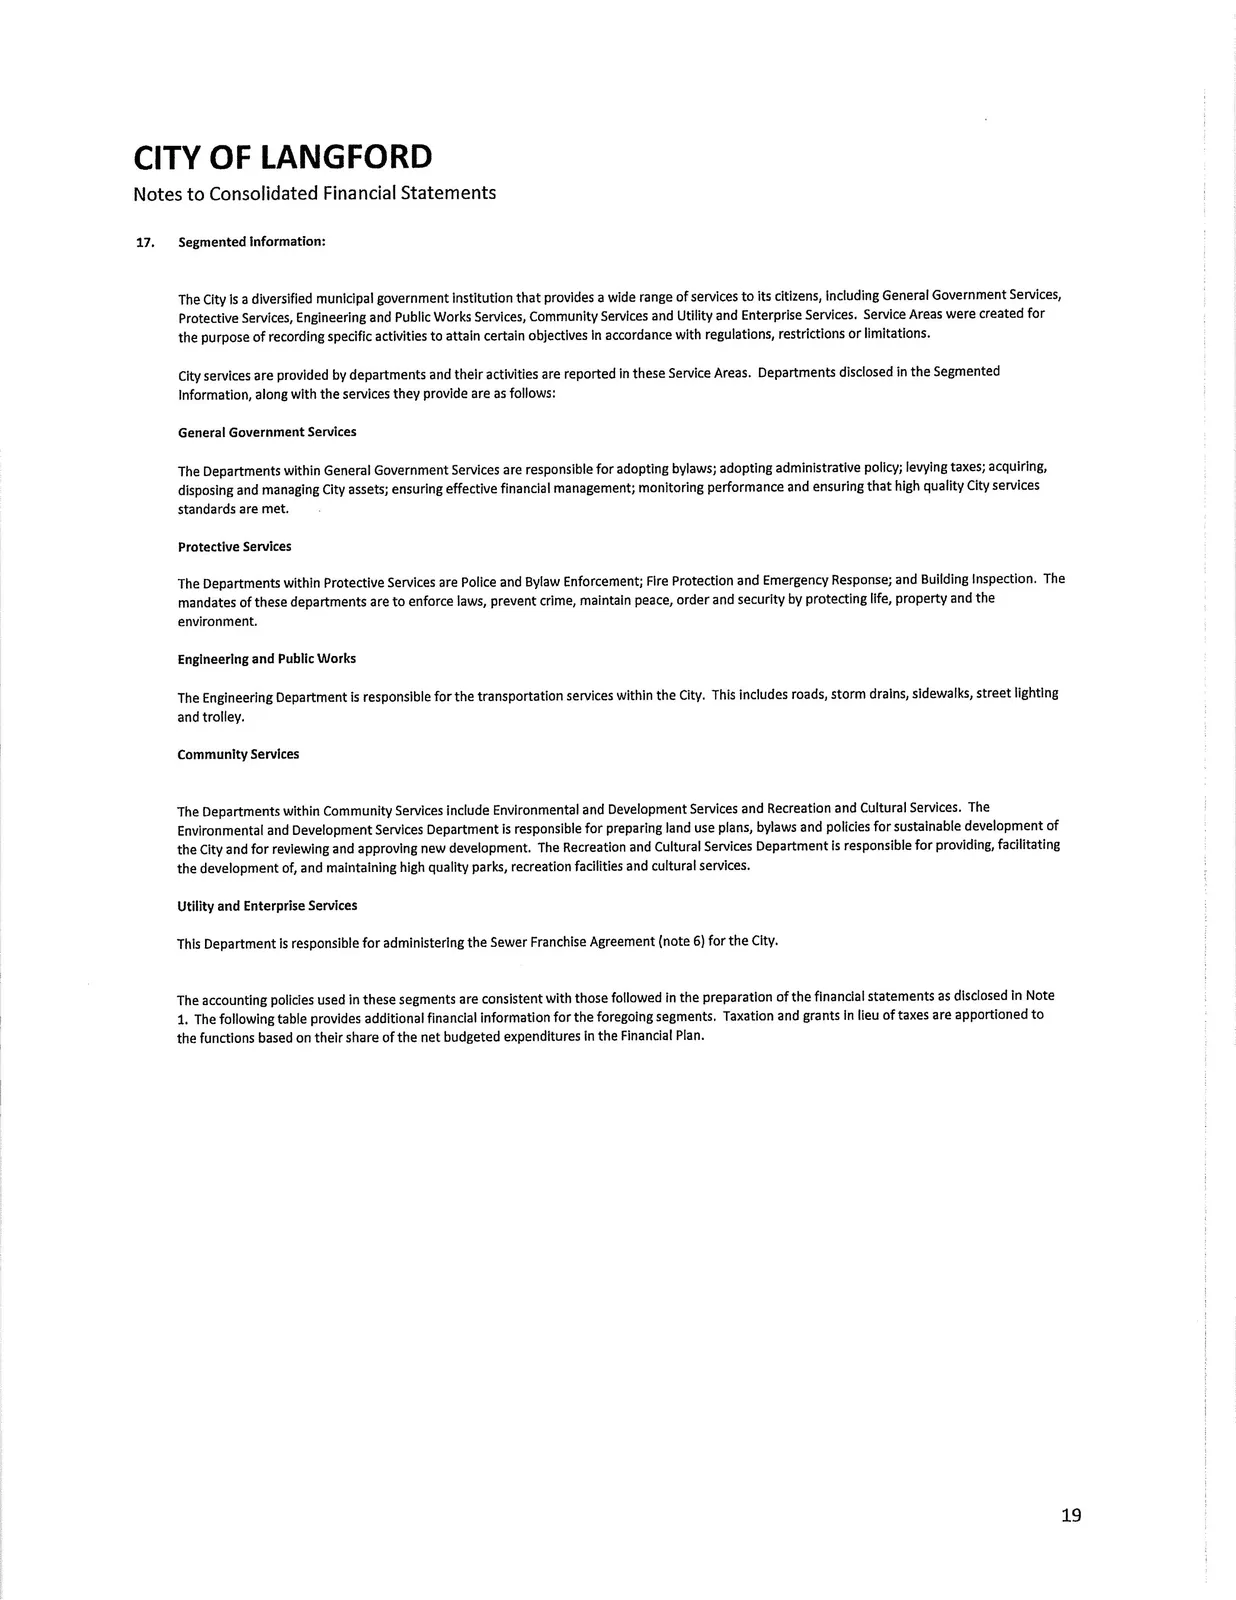
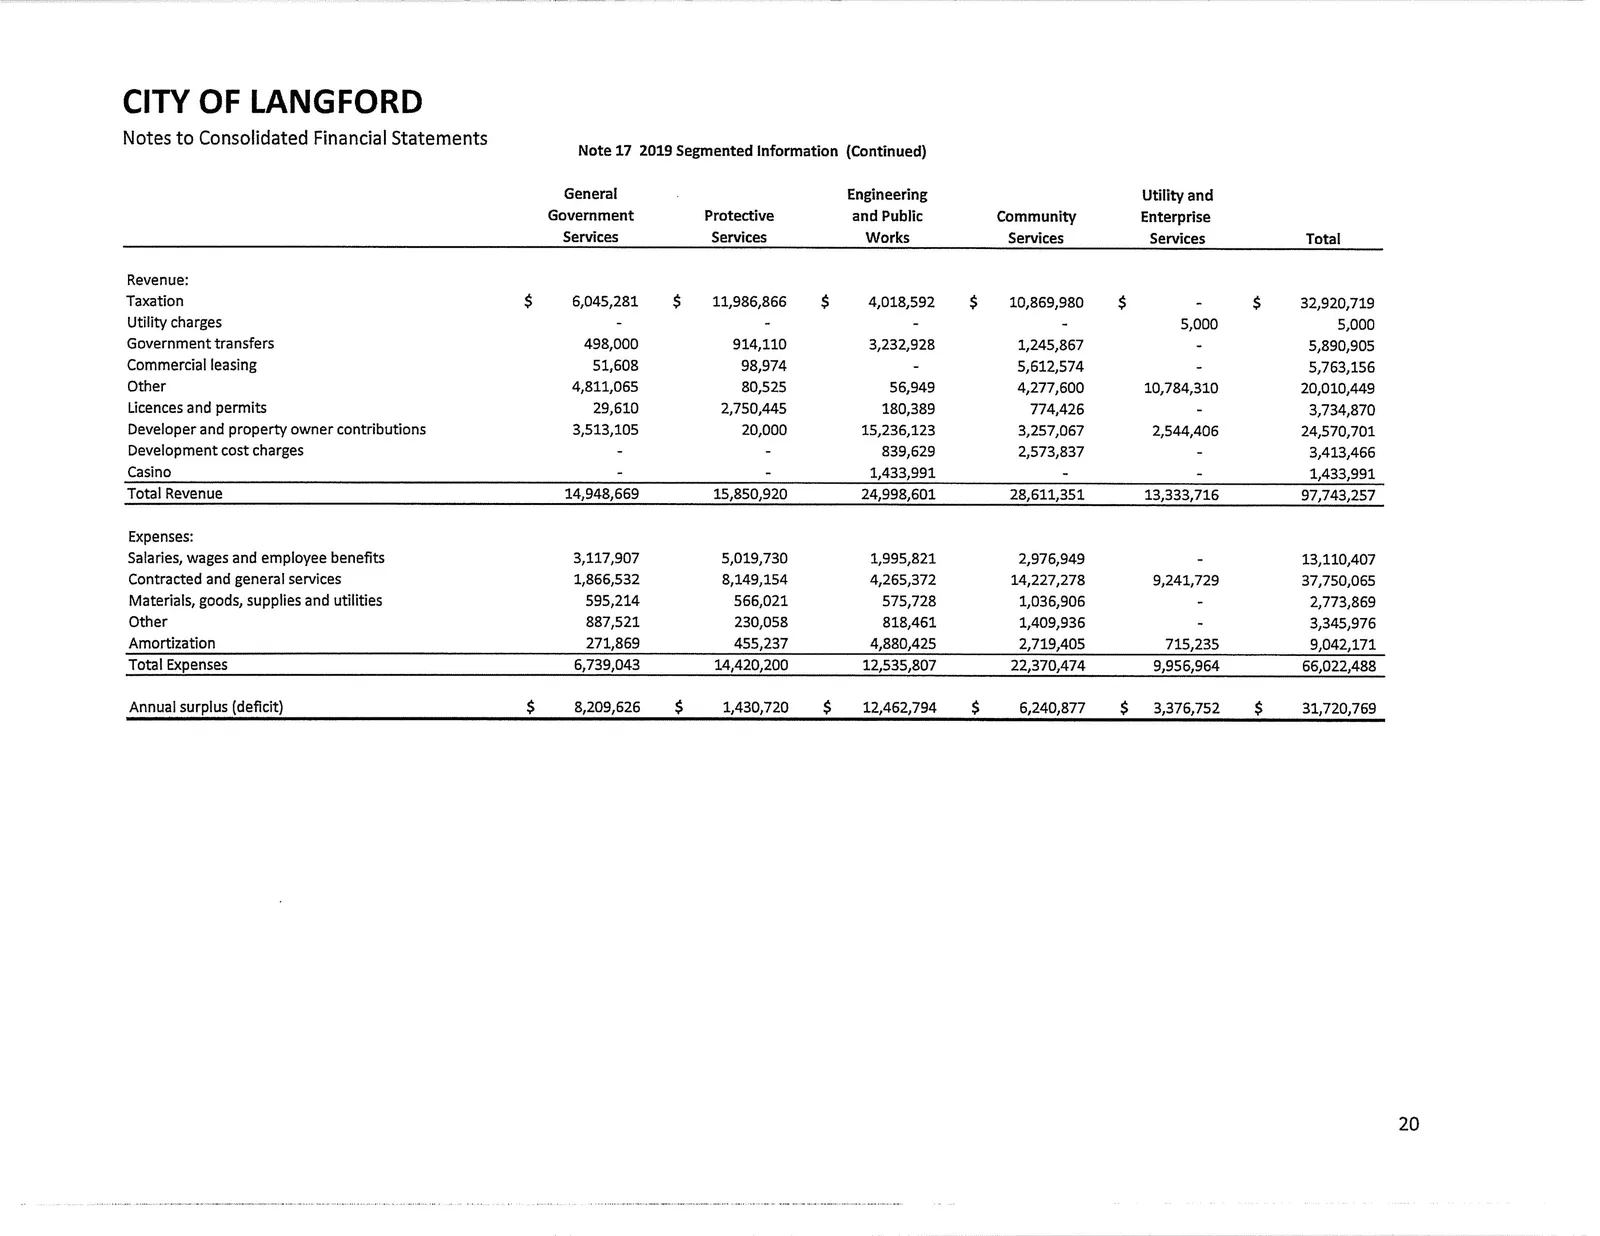
17. Segmented Information
The City provides services in the following segments: General Government Services, Protective Services, Engineering and Public Works, Community Services, and Utility and Enterprise Services. The accounting policies used in these segments are consistent with those in the consolidated financial statements. Taxation and grants in lieu of taxes are apportioned based on share of net budgeted expenditures in the Financial Plan.
Condensed segmented information (2019):
Revenue by segment (2019 totals):
- General Government Services: $14,948,669
- Protective Services: $15,850,920
- Engineering and Public Works: $24,998,601
- Community Services: $28,611,351
- Utility and Enterprise Services: $13,333,716
- Total Revenue: $97,743,257
Expenses by segment (2019 totals):
- General Government Services: $6,739,043
- Protective Services: $14,420,200
- Engineering and Public Works: $12,535,807
- Community Services: $22,370,474
- Utility and Enterprise Services: $9,956,964
- Total Expenses: $66,022,488
Annual surplus by segment (2019):
- General Government Services: $8,209,626
- Protective Services: $1,430,720
- Engineering and Public Works: $12,462,794
- Community Services: $6,240,877
- Utility and Enterprise Services: $3,376,752
- Total Annual Surplus: $31,720,769
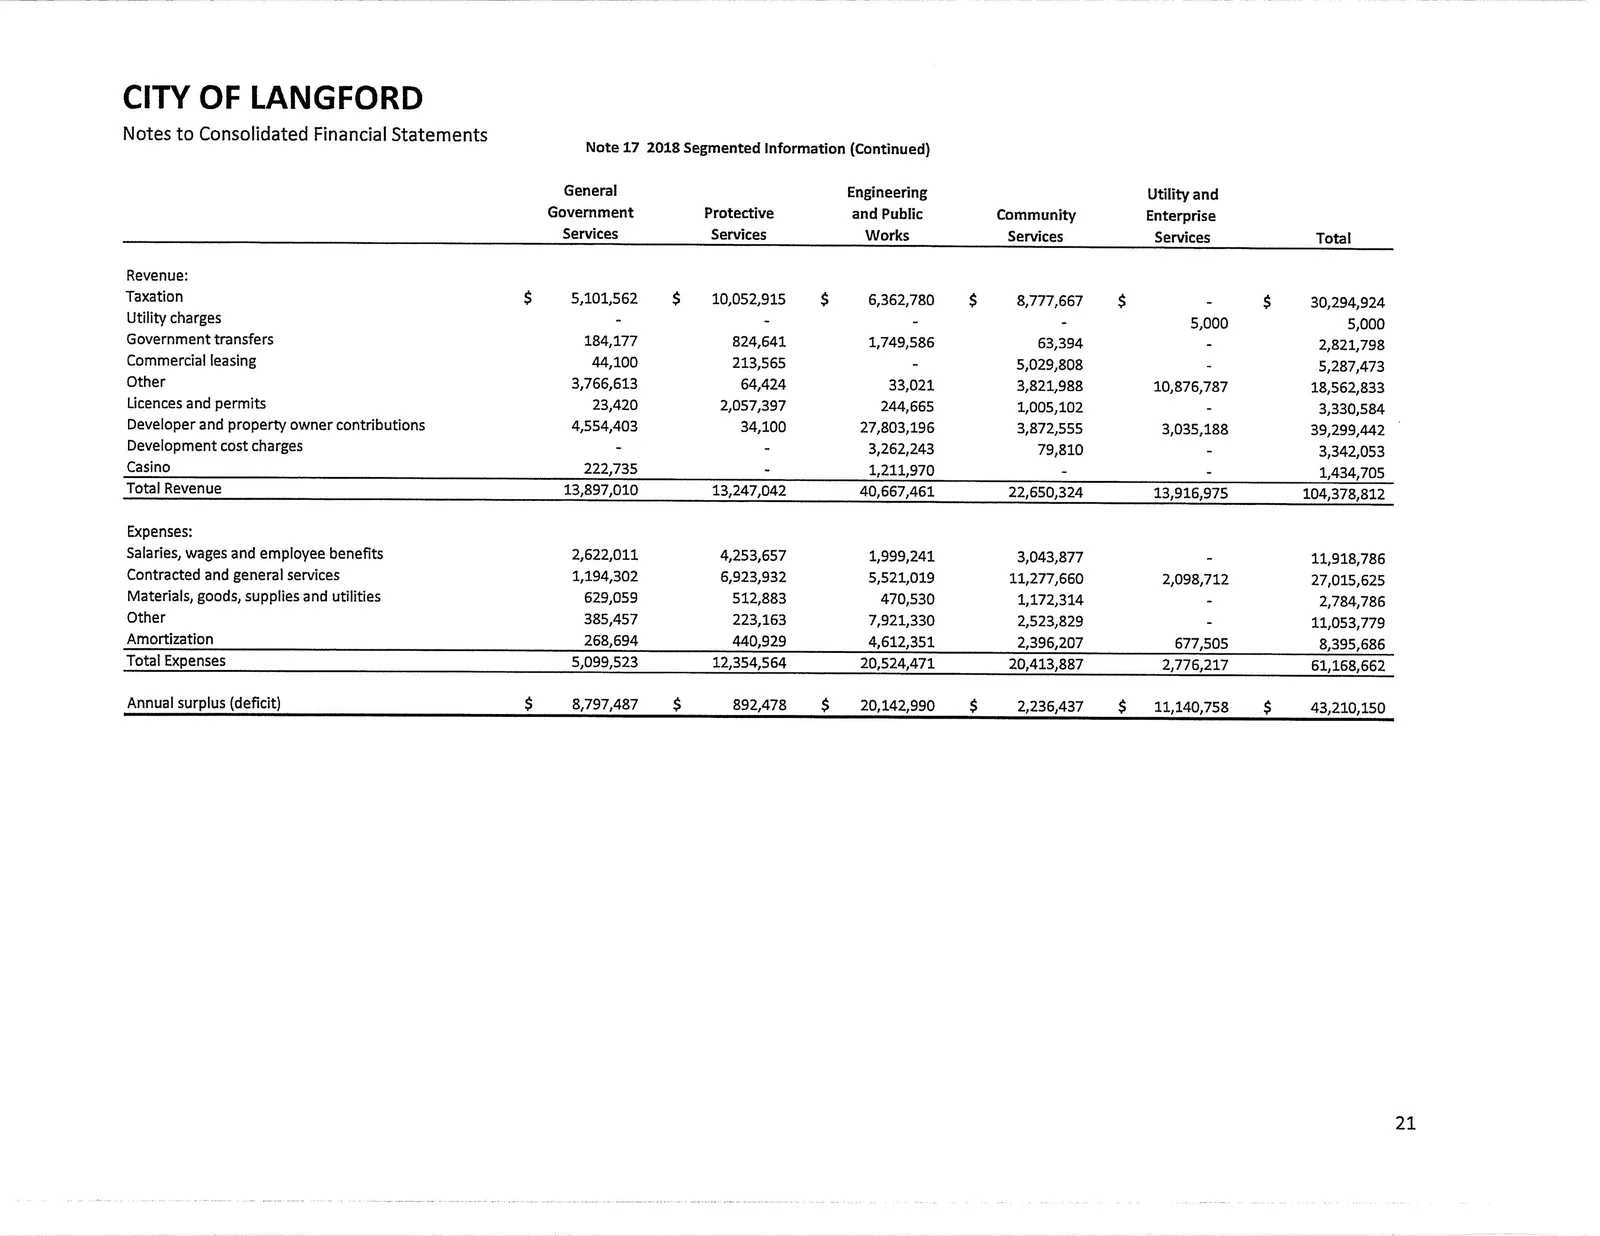
(Comparable segmented information for 2018 is provided in the notes.)
Document Images
(30)