DocumentsStaff ReportFeb 23, 2024Pages 15–55
Proposed 2024–2028 Financial Plan (DRAFT) – AS AT FEBRUARY 8, 2024
Draft five-year (2024–2028) Financial Plan for the City of Langford presenting proposed operating and capital budgets, revenue sources, departmental overviews, reserve transfers, and proposed property tax impacts (including debt servicing related to potential YMCA building acquisition).
Key facts
- Proposed Tax Change (including YMCA debt financing) — proposed tax increases by year: 2024: 11.79%, 2025: 11.19%, 2026: 7.87%, 2027: 7.99%, 2028: 4.89%
- Adjusted (excluding YMCA debt financing) proposed tax increases: 2024: 10.04%, 2025: 9.32%, 2026: 6.61%, 2027: 6.80%, 2028: 5.11%
- Total Property Taxes (by year sample): 2024: $52,193,984; 2025: $59,536,447 (tables provide full yearly breakdowns)
- General – Debt – YMCA/Asset Management amounts: 2024: $3,071,523 (shown in property tax revenue breakdown)
- 2024 Capital Budget total by department: 2024 Total = $111,202,076; Grand Total (2024–2028 capital) = $139,485,076
Proposed 2024–2028 Financial Plan (DRAFT) — AS AT FEBRUARY 8, 2024

Land Acknowledgment
The City of Langford acknowledges and honours the traditional territories of the Coast Salish, specifically Xwsepsum (Esquimalt), Lekwungen (Songhees), Sc’ianew (Beecher Bay), and the W̱ SÁNEĆ Peoples represented by the Tsartlip, Pauquachin, Tsawout, Tseycum, and Malahat Nations.
Contents
- Introduction
- Council Strategic Plan
- City Statistics/Infographic
- Historical Property Tax Information
- Proposed Tax Change
- Commonly Asked Questions
- Operating Budget
- Proposed 2024 – 2028 Operating Budget
- Operating Revenues
- Building Inspection Services
- Development Services
- Engineering and Public Works
- Fire Rescue and the Emergency Program Services
- Fiscal Services
- General Government
- Parks, Recreation and Facilities
- Police (RCMP), and Community Safety and Municipal Bylaw Enforcement
- Capital Budget
- Proposed 2024-2028 Capital Budget
- 2024 Capital Budget
- 2025 Capital Budget
- 2026 Capital Budget
- 2027 Capital Budget
- 2028 Capital Budget
- Reserves
Introduction
The City is proud to present the 2024–2028 Proposed Five Year Financial Plan in an updated and user-friendly format. In 2023, City of Langford Council approved the City’s first Strategic Plan, setting out the shared strategic vision of Council for the next four years and in some cases beyond. The Strategic Plan is a significant guiding document in the development of the Financial Plan. Aligning with objectives 5bi and 5bii in Council’s Strategic Plan, the 2024–2028 proposed Financial Plan is prepared in line with best practices for municipalities in BC, with a fiscally responsible and sustainable lens and presented in a transparent and user-friendly format.
The proposed Financial Plan is informed by the priorities outlined in Council’s Strategic Plan, contractual commitments, current service levels, and technical guidance from staff. Staff prepare a proposed Financial Plan with these inputs for Council’s consideration. During the budget review process, Council will deliberate whether any change in service levels is recommended. Furthermore, as the community continues to grow, consideration must be given to what additional resources are needed to maintain current service levels. In addition to operating budget considerations, Council deliberates on capital projects proposed for the year. Proposed capital projects could be to maintain current service levels, provide capital upgrades to existing infrastructure, or provide a new service or facility within the City.
Within this report, you’ll find information on how property taxes and other revenues are used to maintain current service levels and meet the growing needs of the community. You will also find an overview of the municipality, including a summary of departments and key service areas, as well as the City’s financial information for the 2024–2028 period.
Council Strategic Plan
STRATEGIC PRIORITY ONE
Sustainable Development
STRATEGIC PRIORITY TWO
Climate Change and Environmental Stewardship
STRATEGIC PRIORITY THREE
Economic Development
STRATEGIC PRIORITY FOUR
Transportation
STRATEGIC PRIORITY FIVE
Good Governance
STRATEGIC PRIORITY SIX
Quality of Life
In 2023, City of Langford Council approved its first Strategic Plan. This document sets out the shared strategic vision of Council for the next four years, and in some cases beyond. The Plan reflects Council’s six strategic priorities, and individual objectives in each of those areas. For each objective, the plan sets out an estimated timeline and whether the planned work is currently funded or will be funded in future budgets. The Strategic Plan is a significant guiding document in the development of the Financial Plan.
To learn more, visit Langford.ca/StrategicPlan

City Statistics / Infographic
LAUNCHED IN 2023
- 6,336 PARKS & BOULEVARD TREES MAINTAINED
- 2,405 ACRES OF GREEN SPACE & PARKS
- 2,972 M MULTI-USE TRAILS
- 28 CITY-OWNED PLAYGROUNDS
- 1 SUSPENSION BRIDGE
- 4 PRISTINE LAKES
- 1 PROVINCIAL PARK & CAMPGROUND
- 1,120 M HIKING TRAILS
- 4,186 M MOUNTAIN BIKING TRAILS
JORDIE LUNN BIKE PARK CLUBHOUSE
RESTAURANT | BICYCLE RETAIL | REPAIR & RENTALS | PROGRAMMABLE COMMUNITY SPACE | OFFICE SPACE — OPENING 2024
- 334 BUSINESS LICENSES WERE APPROVED
- 25,844 M2 OF COMMERCIAL SPACE ADDED IN 2023
- 422.4 KM OF ROADWAYS
- 104.9 KM OF SIDEWALKS
- 69 KM OF BIKE LANE
- 37 STORMWATER PONDS (ONGOING MAINTENANCE)
- 2,787 APARTMENTS WITHIN WALKING DISTANCE TO THE DOWNTOWN CORE
- 275 BUS STOPS
- 18 BC TRANSIT ROUTES
- NEW POST-SECONDARY CAMPUS OPENING 2025
- ATTAINABLE HOUSING PROGRAM — 7 HOMES PURCHASED THROUGH THE PROGRAM
- $39,300 ARTS AND CULTURE GRANT FUNDING RECEIVED IN 2023
- PURCHASE OF THE ELECTRIC ZAMBONI FOR WESTHILLS ARENA
- PURCHASE OF THE CITY’S FIRST ELECTRIC FLEET VEHICLE
- 769 REGISTERED USERS (Blink RapidBus Line 95 launched in 2023)
- VISITOR GUIDE & MOBILE INFO CENTRE — 5,099 VISITORS SERVED IN 2023 (FUNDED BY LOCAL HOTEL TAX)
- 2,104 FACEBOOK FOLLOWERS
- 8,542 INSTAGRAM FOLLOWERS
The data presented is the most current available as of December 31, 2023.
POPULATION 49,345 (BC STATS – 2022)

Historical Property Tax Information
Where Your Total Property Tax Bill Went in 2023
- 50.30% General Municipal + Police + West Shore Parks & Recreation + Library
- 29.48% Provincial School
- 10.93% Capital Regional District
- 5.45% BC Transit
- 2.99% Capital Regional Hospital District
- 0.85% BC Assessment Authority (BCAA) & Municipal Finance Authority (MFA)
How Did Langford Compare to Other CRD and Similar Sized Municipalities in 2023?
General Municipal (selected comparisons)
- Sooke 1,594
- North Saanich 1,771
- North Cowichan 1,871
- Metchosin 1,877
- Courtenay 1,892
- Langford 2,095
- Sidney 2,102
- Highlands 2,209
- Vernon 2,239
- View Royal 2,244
- Campbell River 2,306
- Penticton 2,330
- Colwood 2,361
- West Kelowna 2,612
- Central Saanich 2,694
- Average 2,749
- Mission 2,751
- Langley 2,794
- Esquimalt 3,111
- North Vancouver 3,355
- Saanich 3,412
- Victoria 3,458
- Port Moody 4,154
- Oak Bay 5,063
- West Vancouver 5,681
Total Residential Property Taxes and Charges on a Representative House (source: Government of British Columbia)
Proposed Tax Change
| Item | 2023 Budget | 2024 | 2025 | 2026 | 2027 | 2028 |
|---|---|---|---|---|---|---|
| 0002 - General & Police | 38,782,705 | 42,155,437 | 47,656,983 | 51,822,407 | 56,000,426 | 60,605,431 |
| 0003 - General - West Shore Parks & Recreation | 3,137,471 | 3,276,205 | 3,393,489 | 3,529,228 | 3,670,397 | 3,700,000 |
| 0004 - General - Greater Victoria Public Library | 2,404,009 | 2,640,819 | 2,746,452 | 2,856,310 | 2,970,562 | 3,089,385 |
| 0005 - General - Debt | 300,000 | 1,050,000 | 2,000,000 | 2,900,000 | 4,000,000 | 4,000,000 |
| 0006 - General - Debt - YMCA / Asset Management | 384,818 | 3,071,523 | 3,739,523 | 4,611,787 | 5,581,690 | 5,607,572 |
| Total Property Taxes | 45,009,003 | 52,193,984 | 59,536,447 | 65,719,732 | 72,223,075 | 77,002,388 |
- Non-market change revenue: 1,879,000 (2023); 1,500,000 (2024–2026); 1,250,000 (2027–2028)
- Property Taxes - for calculation of proposed tax increase (net of Non-market change): 50,314,984 (2023), 58,036,447 (2024), 64,219,732 (2025), 70,973,075 (2026), 75,752,388 (2027), 77,002,388 (2028)
Proposed Tax Increase, including debt financing for YMCA building purchase/asset management:
- 11.79% (2024)
- 11.19% (2025)
- 7.87% (2026)
- 7.99% (2027)
- 4.89% (2028)
Potential reduction in property taxes, subject to decision to purchase YMCA building:
- 786,705 (2024)
- 1,839,523 (2025)
- 2,711,787 (2026)
- 3,681,690 (2027)
- 3,707,572 (2028)
Adjusted property taxes for tax increase calculation (excluding YMCA debt):
- 49,528,279 (2024)
- 56,196,924 (2025)
- 61,507,945 (2026)
- 67,291,385 (2027)
- 72,044,816 (2028)
Potential adjusted tax increase, excluding debt financing for YMCA building purchase/asset management:
- 10.04% (2024)
- 9.32% (2025)
- 6.61% (2026)
- 6.80% (2027)
- 5.11% (2028)
Commonly Asked Questions
What is a Financial Plan and is it required?
A Financial Plan is a document created by the City that sets a five-year operating and capital budget. These budgets take into consideration Council’s Strategic Plan while ensuring service level standards and the community’s priorities are met. Prior to May 15 each year, Council must adopt both a Five-Year Financial Plan Bylaw and a Property Tax Rates Bylaw.
What is an operating budget?
The operating budget covers the ongoing, day-to-day expenses the City incurs to provide programs and services to the residents of Langford. Examples of these items include fire and police services, roads and park structures maintenance and staff salaries.
How is the operating budget funded?
Langford’s operating budget is funded through property tax revenue, user fees and permits, grants, investments, and transfers from various reserves.
What is a capital budget?
The capital budget outlines the City’s acquisition, construction, and replacement of capital assets. Examples of these projects include vehicle and equipment replacement, construction of roads, park structures, trail improvements and land acquisition.
How are capital projects funded?
Funding sources for capital projects range from reserves, Development Cost Charges (DCCs), grants, debt financing, and developer contributions.
Operating Budget
Proposed 2024 – 2028 Operating Budget
| 2023 Budget | 2024 | 2025 | 2026 | 2027 | 2028 | |
|---|---|---|---|---|---|---|
| Operating Revenue | ||||||
| Property Taxes | 45,009,003 | 52,193,984 | 59,536,447 | 65,719,732 | 72,223,075 | 77,002,388 |
| Other Taxation Revenues | 2,300,072 | 5,042,791 | 5,111,779 | 5,141,170 | 5,172,149 | 5,204,840 |
| Transfers from Reserves and Surplus | 4,343,148 | 7,126,324 | 3,480,721 | 2,759,395 | 2,534,916 | 2,186,727 |
| Licenses and Permits | 4,057,447 | 3,848,700 | 3,712,300 | 3,624,900 | 3,637,500 | 3,650,100 |
| Other Revenue | 11,011,127 | 11,282,790 | 11,155,344 | 11,073,285 | 10,976,494 | 10,976,017 |
| Unconditional Grants | 450,000 | 430,000 | 430,000 | 430,000 | 430,000 | 430,000 |
| Conditional Grants | 641,729 | 1,727,454 | 867,544 | 872,158 | 875,181 | 878,294 |
| Total Operating Revenue | 67,812,526 | 81,652,043 | 84,294,135 | 89,620,640 | 95,849,315 | 100,328,366 |
| 2023 Budget | 2024 | 2025 | 2026 | 2027 | 2028 | |
|---|---|---|---|---|---|---|
| Operating Expenses | ||||||
| Building Inspection Services | 1,047,944 | 949,789 | 1,100,020 | 1,163,598 | 1,206,495 | 1,232,798 |
| Development Services | 2,097,467 | 3,125,861 | 2,514,194 | 2,259,187 | 2,321,683 | 2,379,724 |
| Engineering & Public Works | 8,621,880 | 9,620,312 | 9,958,225 | 9,804,640 | 10,121,225 | 10,397,703 |
| Fire Rescue Services & Emergency Program | 5,473,981 | 6,828,467 | 8,142,508 | 9,232,426 | 9,526,888 | 9,762,873 |
| Fiscal Services | 5,421,559 | 12,768,871 | 12,884,461 | 14,651,725 | 17,466,628 | 16,582,510 |
| General Government | 9,344,344 | 11,530,098 | 11,709,928 | 12,874,267 | 13,940,279 | 17,113,209 |
| Greater Victoria Public Library* | - | 2,935,815 | 3,047,698 | 3,163,941 | 3,287,016 | 3,412,550 |
| Parks, Recreation & Facilities | 15,375,773 | 13,585,691 | 13,617,795 | 13,971,806 | 14,338,172 | 14,672,644 |
| Police & CSME** | 15,392,107 | 17,030,934 | 17,925,817 | 18,969,822 | 19,970,532 | 20,957,142 |
| Recreation Purchase of Service | 1,900,000 | - | - | - | - | - |
| West Shore Parks & Recreation* | 3,137,471 | 3,276,205 | 3,393,489 | 3,529,228 | 3,670,397 | 3,817,213 |
| Total Operating Expenses | 67,812,526 | 81,652,043 | 84,294,135 | 89,620,640 | 95,849,315 | 100,328,366 |
*Greater Victoria Public Library and West Shore Parks & Recreation operating expenses are included within the Parks, Recreation, & Facilities Department overview on pages 24 and 25.
** CSME is Community Safety and Municipal Bylaw Enforcement
Proposed Operating Expenses breakdown (percentages shown in original visual):
- Police (RCMP) and CSME: 20.86%
- Parks, Recreation, & Facilities: 16.64%
- Fiscal Services: 15.64%
- General Government: 14.12%
- Engineering & Public Works: 11.78%
- Fire Rescue Services and the Emergency Program: 8.36%
- West Shore Parks & Recreation*: 4.01%
- Development Services: 3.83%
- Greater Victoria Public Library*: 3.60%
- Building Inspection Services: 1.16%
Operating Revenues
Property Tax Revenues (selected lines)
| Item | 2023 Budget | 2024 | 2025 | 2026 | 2027 | 2028 |
|---|---|---|---|---|---|---|
| General & Police | 38,782,705 | 42,155,437 | 47,656,983 | 51,822,407 | 56,000,426 | 60,605,431 |
| General - West Shore Parks & Rec | 3,137,471 | 3,276,205 | 3,393,489 | 3,529,228 | 3,670,397 | 3,700,000 |
| General - Library | 2,404,009 | 2,640,819 | 2,746,452 | 2,856,310 | 2,970,562 | 3,089,385 |
| General - Debt | 300,000 | 1,050,000 | 2,000,000 | 2,900,000 | 4,000,000 | 4,000,000 |
| General - Debt - YMCA / Asset Management | 384,818 | 3,071,523 | 3,739,523 | 4,611,787 | 5,581,690 | 5,607,572 |
| Parcel Tax - LSA | 1,638,438 | 4,313,438 | 4,313,438 | 4,313,438 | 4,313,438 | 4,313,438 |
| Grant in Lieu | 165,918 | 192,000 | 196,000 | 200,000 | 204,000 | 208,000 |
| 1% Utility Tax | 495,715 | 537,353 | 602,341 | 627,732 | 654,711 | 683,402 |
| Total Property Tax Revenues | 47,309,075 | 57,236,775 | 64,648,226 | 70,860,902 | 77,395,224 | 82,207,228 |
Non-Tax Revenue (selected lines)
| Item | 2023 Budget | 2024 | 2025 | 2026 | 2027 | 2028 |
|---|---|---|---|---|---|---|
| Total Sale of Services | 5,000 | 5,000 | 5,000 | 5,000 | 5,000 | 5,000 |
| Total Licences & Permits | 4,052,447 | 3,843,700 | 3,707,300 | 3,619,900 | 3,632,500 | 3,645,100 |
| Total Rentals | - | 55,000 | 55,000 | 55,000 | 55,000 | 55,000 |
| Total Interest Income | 550,000 | 750,000 | 600,000 | 500,000 | 500,000 | 500,000 |
| Total Penalties & Interest On Taxes | 440,515 | 442,325 | 444,171 | 447,000 | 447,000 | 447,000 |
| Total Commercial Leasing | 125,848 | 116,165 | 114,711 | 113,235 | 113,944 | 112,467 |
| Total Casino | 1,400,000 | 1,400,000 | 1,400,000 | 1,400,000 | 1,400,000 | 1,400,000 |
| Total Other Revenue | 8,494,764 | 8,519,300 | 8,541,462 | 8,558,050 | 8,460,550 | 8,461,550 |
| Total Unconditional Grants | 450,000 | 430,000 | 430,000 | 430,000 | 430,000 | 430,000 |
| Total Conditional Grants | 641,729 | 1,727,454 | 867,544 | 872,158 | 875,181 | 878,294 |
| Total Transfers From Reserve Funds | 3,066,985 | 3,353,635 | 3,005,475 | 2,354,395 | 2,129,916 | 1,781,727 |
| Total Transfers From Reserve Accounts & Surplus | 1,276,163 | 3,772,689 | 475,246 | 405,000 | 405,000 | 405,000 |
| Total Non-Tax Revenue | 20,503,451 | 24,415,268 | 19,645,909 | 18,759,738 | 18,454,091 | 18,121,138 |
| Total Revenues | 67,812,526 | 81,652,043 | 84,294,135 | 89,620,640 | 95,849,315 | 100,328,366 |
Building Inspection Services
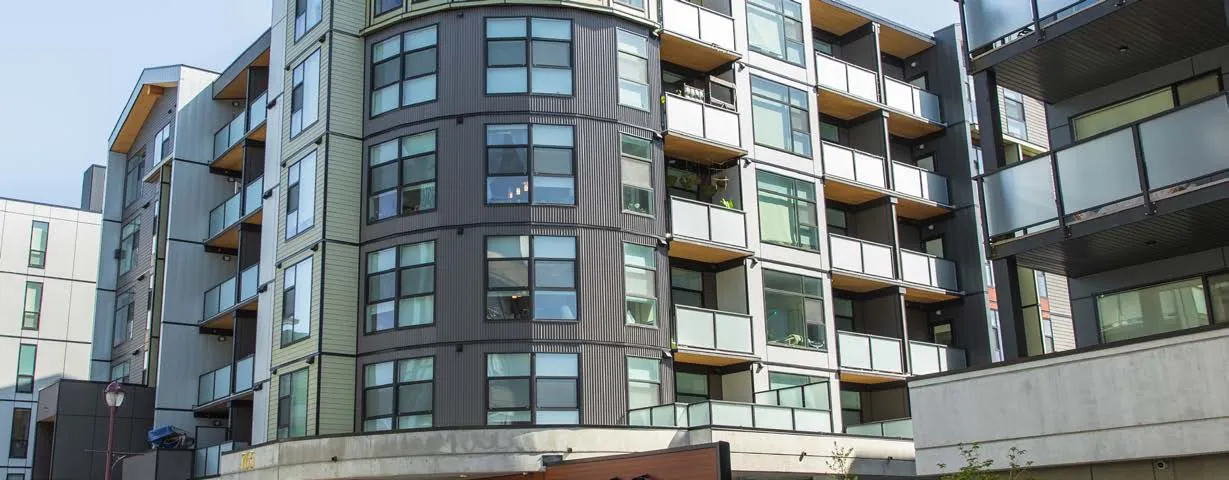
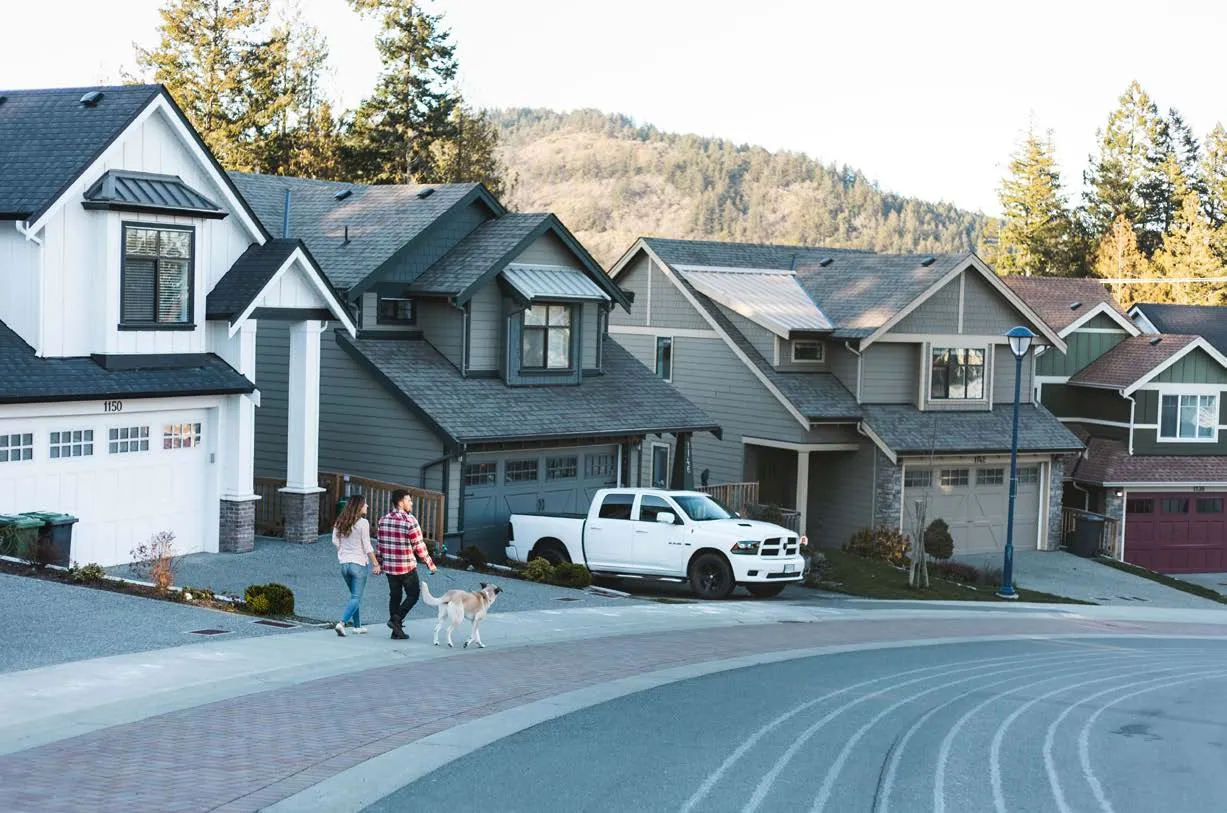
The Building Services department is responsible for ensuring compliance with the current British Columbia Building Code and other building regulations, including the City of Langford’s Building Bylaw No. 1160, 2008. The department reviews all building permit submissions and conducts on-site inspections of new construction, commercial tenant improvements, and residential renovations. The department also reviews business licenses for compliance with the Building Bylaw requirements.
Budget Overview (Building Inspection)
| 2023 Budget | 2024 | 2025 | 2026 | 2027 | 2028 | |
|---|---|---|---|---|---|---|
| Building Inspection Administration | 1,025,175 | 928,121 | 1,077,779 | 1,140,831 | 1,183,186 | 1,208,939 |
| Building Fleet | 13,269 | 13,668 | 14,001 | 14,280 | 14,567 | 14,855 |
| Board of Variance | 9,500 | 8,000 | 8,240 | 8,487 | 8,742 | 9,004 |
| Total Building Inspection | 1,047,944 | 949,789 | 1,100,020 | 1,163,598 | 1,206,495 | 1,232,798 |
Key Stats From 2023
- PERMITS ISSUED: 674
- RESIDENTIAL UNITS CREATED: 891
- SINGLE FAMILY HOMES: 168
- DUPLEX: 26
- TOWNHOUSES: 153
- MULTIFAMILY: 544
Key Service Functions and Budget Initiatives for 2024
- Ensure compliance with the BC Building Code
- Ensure compliance with Building Bylaw No. 1160, 2008.
- Issue building permits
- Conduct on-site inspections
- Conduct plan reviews
Development Services
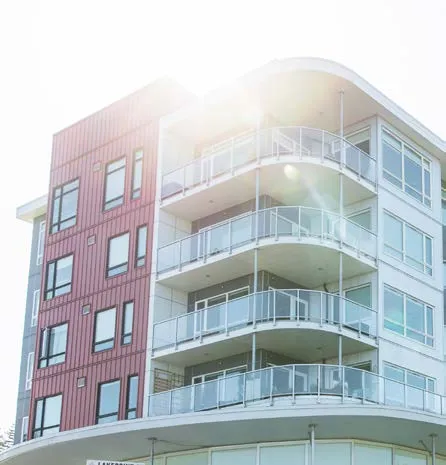
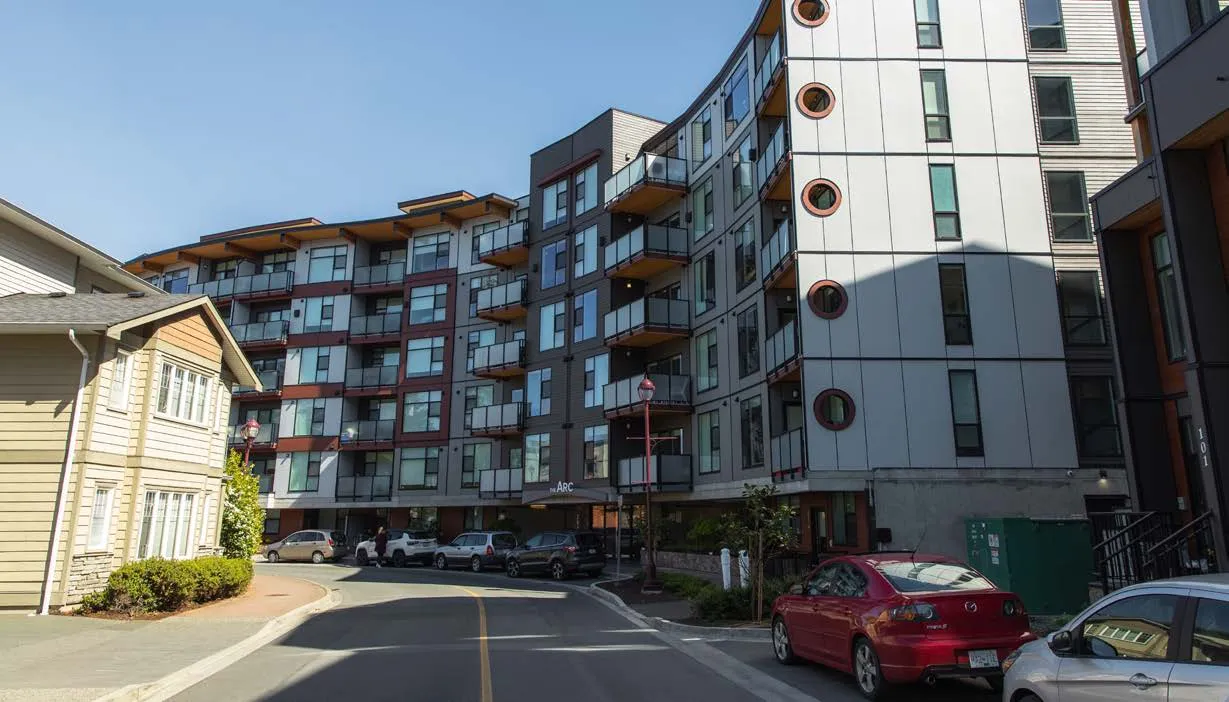
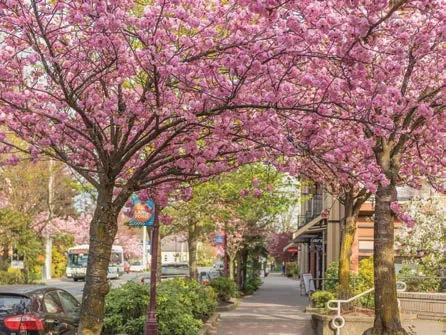
The Development Services department provides professional and technical advice on land use, development applications, housing, climate action, social policy, and supports the Official Community Plan and planning policy documents. Staff advise on land uses, housing, environment, climate action, and social policy; provide recommendations to committees and Council; and manage day-to-day planning operations including subdivisions, servicing, and related policies.
Key Service Functions and Budget Initiatives for 2024
- Process subdivision and current planning development applications
- Oversee and monitor the City’s Affordable Housing and Attainable Home Ownership Programs
- Update and ensure relevancy of the City’s housing policies and targets, including the Housing Needs Report
- Update the Official Community Plan
- Initiate development of a Climate Action Master Plan
- Review and convert the current Amenity Contribution Policy into an Amenity Cost Charge Bylaw
- Coordinate the creation of an Urban Forest Management Plan
- Review and update the Development Permit and Design Guidelines
- Update the Zoning Bylaw to reflect new provincial legislation requirements
Key Stats From 2023
- REZONING APPLICATIONS RECEIVED: 29
- DEVELOPMENT VARIANCE PERMIT APPLICATIONS RECEIVED: 13
- DEVELOPMENT PERMIT APPLICATIONS RECEIVED: 90
- LOTS CREATED BY SUBDIVISION: 504
Budget Overview (Development Services)
| 2023 Budget | 2024 | 2025 | 2026 | 2027 | 2028 | |
|---|---|---|---|---|---|---|
| Planning (subtotal) | 410,560 | 405,290 | 417,319 | 432,308 | 442,468 | 455,612 |
| Subdivision & Land Development | 1,686,907 | 2,720,571 | 2,096,875 | 1,826,879 | 1,879,215 | 1,924,112 |
| Total Development Services | 2,097,467 | 3,125,861 | 2,514,194 | 2,259,187 | 2,321,683 | 2,379,724 |
Engineering and Public Works
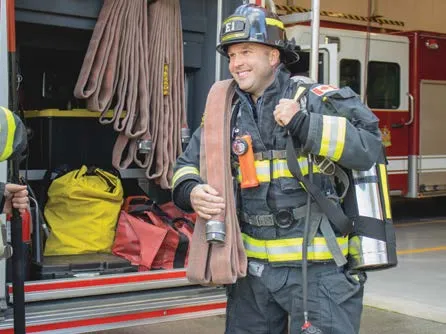
The Engineering and Public Works department is responsible for construction related to subdivisions and capital projects, road maintenance and repairs, and beautification efforts. Responsibilities include planning, designing, constructing, and maintaining municipal infrastructure: roads, stormwater management, traffic signals, sidewalks, bike lanes, streetlights, culverts, and oversight of road maintenance contracts. The department collaborates with West Shore Environmental Services, the Capital Regional District, BC Transit, School District #62, and other utility providers.
Key Service Functions and Budget Initiatives for 2024
- Initiate the development of an Active Transportation Plan
- Initiate development of a Transportation Master Plan
- Develop a construction impact management strategy and ‘good neighbor’ policy
- Completion of a new signalized intersection at Klahanie Dr and Latoria Rd
- Safety improvements to the West Shore Parkway at Amy Rd roundabout
- Continue to improve and expand active transportation infrastructure:
- Treanor Ave sidewalk (City Gate to Lakewood Elementary)
- Completion of 900 blk Goldstream Ave sidewalk and bike lanes
- Multi-use path along Klahanie Dr (constructed with new traffic signal)
Key Stats From 2023
- 8 KMs OF ADDITIONAL ROAD INSTALLED (TOTAL 422 KMS)
- 2 KMs ADDITIONAL SIDEWALK INSTALLED
- 1.4 KMs ADDITIONAL BIKE LANES INSTALLED
- 255+ STORMWATER DEVICES CLEANED AND MAINTAINED
- 8 KM+ STORMWATER PIPES CLEANED
Budget Overview (Engineering & Public Works)
| 2023 Budget | 2024 | 2025 | 2026 | 2027 | 2028 | |
|---|---|---|---|---|---|---|
| Engineering - Common Services | 2,247,479 | 2,893,984 | 2,587,666 | 2,667,806 | 2,747,901 | 2,823,640 |
| Public Works | 6,374,401 | 6,726,328 | 7,370,559 | 7,136,834 | 7,373,324 | 7,574,063 |
| Total Engineering & Public Works | 8,621,880 | 9,620,312 | 9,958,225 | 9,804,640 | 10,121,225 | 10,397,703 |
(See detailed line items in the original tables for breakdowns: Engineering Administration, Luxton Yard, Engineering Fleet, Traffic Signals, Road Maintenance, Boulevard Maintenance, Storm Drain Maintenance, etc.)
Fire Rescue Services and the Emergency Program
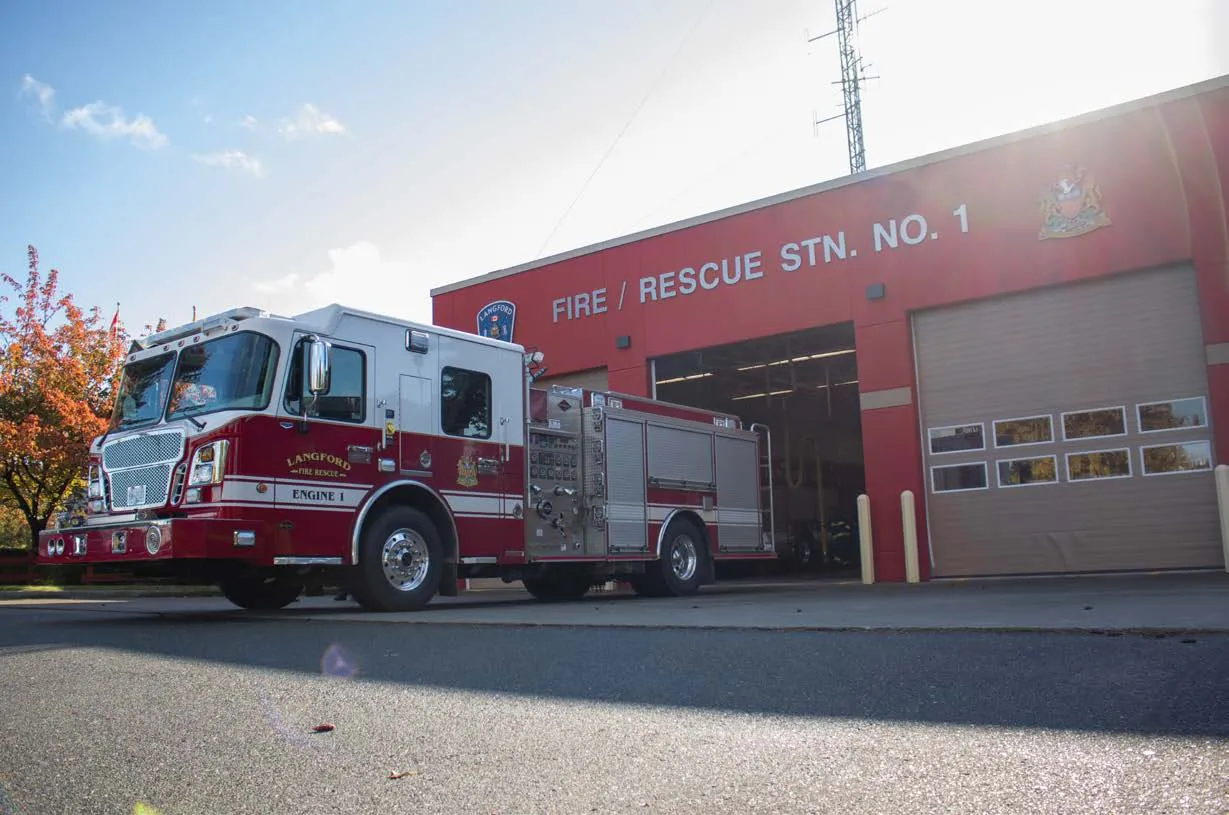

Langford Fire Rescue is a composite fire department (career and volunteer) operating from three stations. Services include fire suppression, first response, auto extrication, water rescue, rope rescue, and technical high-angle rescue. The department trains and plans for mitigation, prevention, response, and recovery and coordinates the Langford Emergency Program.
Key Service Functions and Budget Initiatives for 2024
- Conducting emergency call response
- Conducting fire and life safety initiatives, including fire safety presentations, fire inspections, FireSmart assessments, and emergency preparedness information delivery
- Overseeing the Langford Emergency Program
- Continued implementation of the Fire Master Plan
- Second year of a three-year plan to provide coverage from Station 2
Key Stats From 2023
- FIRE RESPONSES: 1,300+ (increase of 9% from 2022)
- FIRE PREVENTION INSPECTIONS: 300+
- FLEET: 15 apparatus (including two new firetrucks in 2023)
- TRAINING DRILLS: 400+
Budget Overview (Fire Rescue)
| 2023 Budget | 2024 | 2025 | 2026 | 2027 | 2028 | |
|---|---|---|---|---|---|---|
| Fire Rescue Services | 5,473,981 | 6,828,467 | 8,142,508 | 9,232,426 | 9,526,888 | 9,762,873 |
(See detailed line items in original table for Fire Fleet, Firefighter Training, Firefighting Force, Fire Stations, Communication Centre, Fire Equipment Maintenance, Fire Administration, Emergency Measures.)
Fiscal Services
Fiscal Services includes:
- Bank charges & interest (general bank charges and interest portion of debt payments)
- Principal repayment (principal portion of debt payments)
- Transfers to own reserves (transfers from general operating revenue into the City’s various reserve accounts)
Budget Overview (Fiscal Services)
| 2023 Budget | 2024 | 2025 | 2026 | 2027 | 2028 | |
|---|---|---|---|---|---|---|
| Bank Charges & Interest | 514,831 | 2,492,250 | 2,472,250 | 2,447,250 | 2,442,250 | 2,442,250 |
| Principal Repayment | 1,827,925 | 5,609,211 | 5,907,211 | 6,799,475 | 7,769,378 | 6,885,260 |
| Transfers to Own Funds & Reserves | 3,078,803 | 4,667,410 | 4,505,000 | 5,405,000 | 7,255,000 | 7,255,000 |
| Total Fiscal Services | 5,421,559 | 12,768,871 | 12,884,461 | 14,651,725 | 17,466,628 | 16,582,510 |
(See detailed line items in original table for breakdowns: specific interest categories, principal by type, transfers to capital fund, equipment reserve, police capital reserve, general amenity reserve, etc.)
General Government

The General Government section includes:
- General Government Administration (Corporate Services & Human Resources, Communications & Economic Development, Legislative Services & Records Management, Finance, IT & GIS, Common Services)
- Council (travel & training, contingency, election costs)
- City Hall and related administration and rental properties
Budget Overview (General Government)
| 2023 Budget | 2024 | 2025 | 2026 | 2027 | 2028 | |
|---|---|---|---|---|---|---|
| Council | 652,414 | 655,041 | 669,239 | 764,223 | 699,597 | 715,374 |
| General Government Administration | 5,911,095 | 7,729,262 | 7,560,082 | 8,402,369 | 9,434,625 | 12,503,284 |
| General Government - Other | 2,780,835 | 3,145,795 | 3,480,607 | 3,707,675 | 3,806,057 | 3,894,551 |
| Total General Government | 9,344,344 | 11,530,098 | 11,709,928 | 12,874,267 | 13,940,279 | 17,113,209 |
(See original tables for detailed line items: Network Administration, Records Management, GIS and Mapping, Asset Management, Finance, Common Services, City Hall Equipment, Internet Services, etc.)
Parks, Recreation, and Facilities
The Parks, Recreation, and Facilities department is responsible for capital construction, operations, and maintenance of City-owned parks, trails, boulevards, recreational facilities, and other properties (City Hall, City Centre Park, Starlight Stadium, Jordie Lunn Bike Park). This section includes the requisition for West Shore Parks and Recreation and the Greater Victoria Public Library.
Key Service Functions and Budget Initiatives for 2024
- Creation and implementation of Langford’s first Parks, Recreation, and Trails Master Plan
- Grand opening of Jordie Lunn Clubhouse
- Replacement of the Cy Jenkins Boardwalk on Glen Lake
- Creation of new climbing/hiking and downhill mountain bike trails at the Langford Gravity Zone
- Revitalization of Porcher Park
- Addition of shade sails and greenery at The Langford Station
- Renovation of tennis courts at Centennial Park
- Installation of an accessible dock at the Langford Lake boat launch
Key Stats From 2023
- NEW OR RENOVATED PARKS AND PLAYGROUNDS: 4
- TOTAL GREEN SPACE AND PARKS: 2,392 ACRES
- TOTAL BOULEVARDS MAINTAINED: 249,770 SQ M
- CLUBHOUSE BUILDING AT JORDIE LUNN BIKE PARK (opening 2024)
- DEVELOPMENT OF NEW TRAILS at Langford Gravity Zone & Nature Trails
- NEW FULL-SIZED ARTIFICIAL TURF FIELD WITH LIGHTING installed on Flint Ave
Budget Overview (Parks, Recreation & Facilities)
| 2023 Budget | 2024 | 2025 | 2026 | 2027 | 2028 | |
|---|---|---|---|---|---|---|
| Parks & Trails Maintenance | 473,070 | 626,544 | 572,602 | 631,375 | 644,491 | 659,339 |
| Natural Areas Management | 27,442 | 25,903 | 23,983 | 24,472 | 24,971 | 25,479 |
| Recreation Facilities | 2,620,663 | 2,922,723 | 2,924,122 | 2,994,784 | 3,067,310 | 3,142,051 |
| Boulevards - Parks | 161,544 | 175,474 | 179,266 | 183,002 | 186,298 | 189,656 |
| Cultural Services - Arts | 6,230,499 | 6,449,761 | 6,481,319 | 6,601,923 | 6,774,463 | 6,910,229 |
| Parks Administration | 3,061,736 | 3,236,950 | 3,281,781 | 3,375,128 | 3,472,139 | 3,570,920 |
| Total Parks, Recreation & Facilities | 15,375,773 | 13,585,691 | 13,617,795 | 13,971,806 | 14,338,172 | 14,672,644 |
| Westshore Parks & Recreation (requisition) | 3,137,471 | 3,276,205 | 3,393,489 | 3,529,228 | 3,670,397 | 3,817,213 |
| Library Services (Greater Victoria Public Library) | 2,935,815 (2024) | 3,047,698 (2025) | 3,163,941 (2026) | 3,287,016 (2027) | 3,412,550 (2028) |
Police (RCMP) and Community Safety & Municipal Bylaw Enforcement (CSME)
Police (West Shore RCMP)
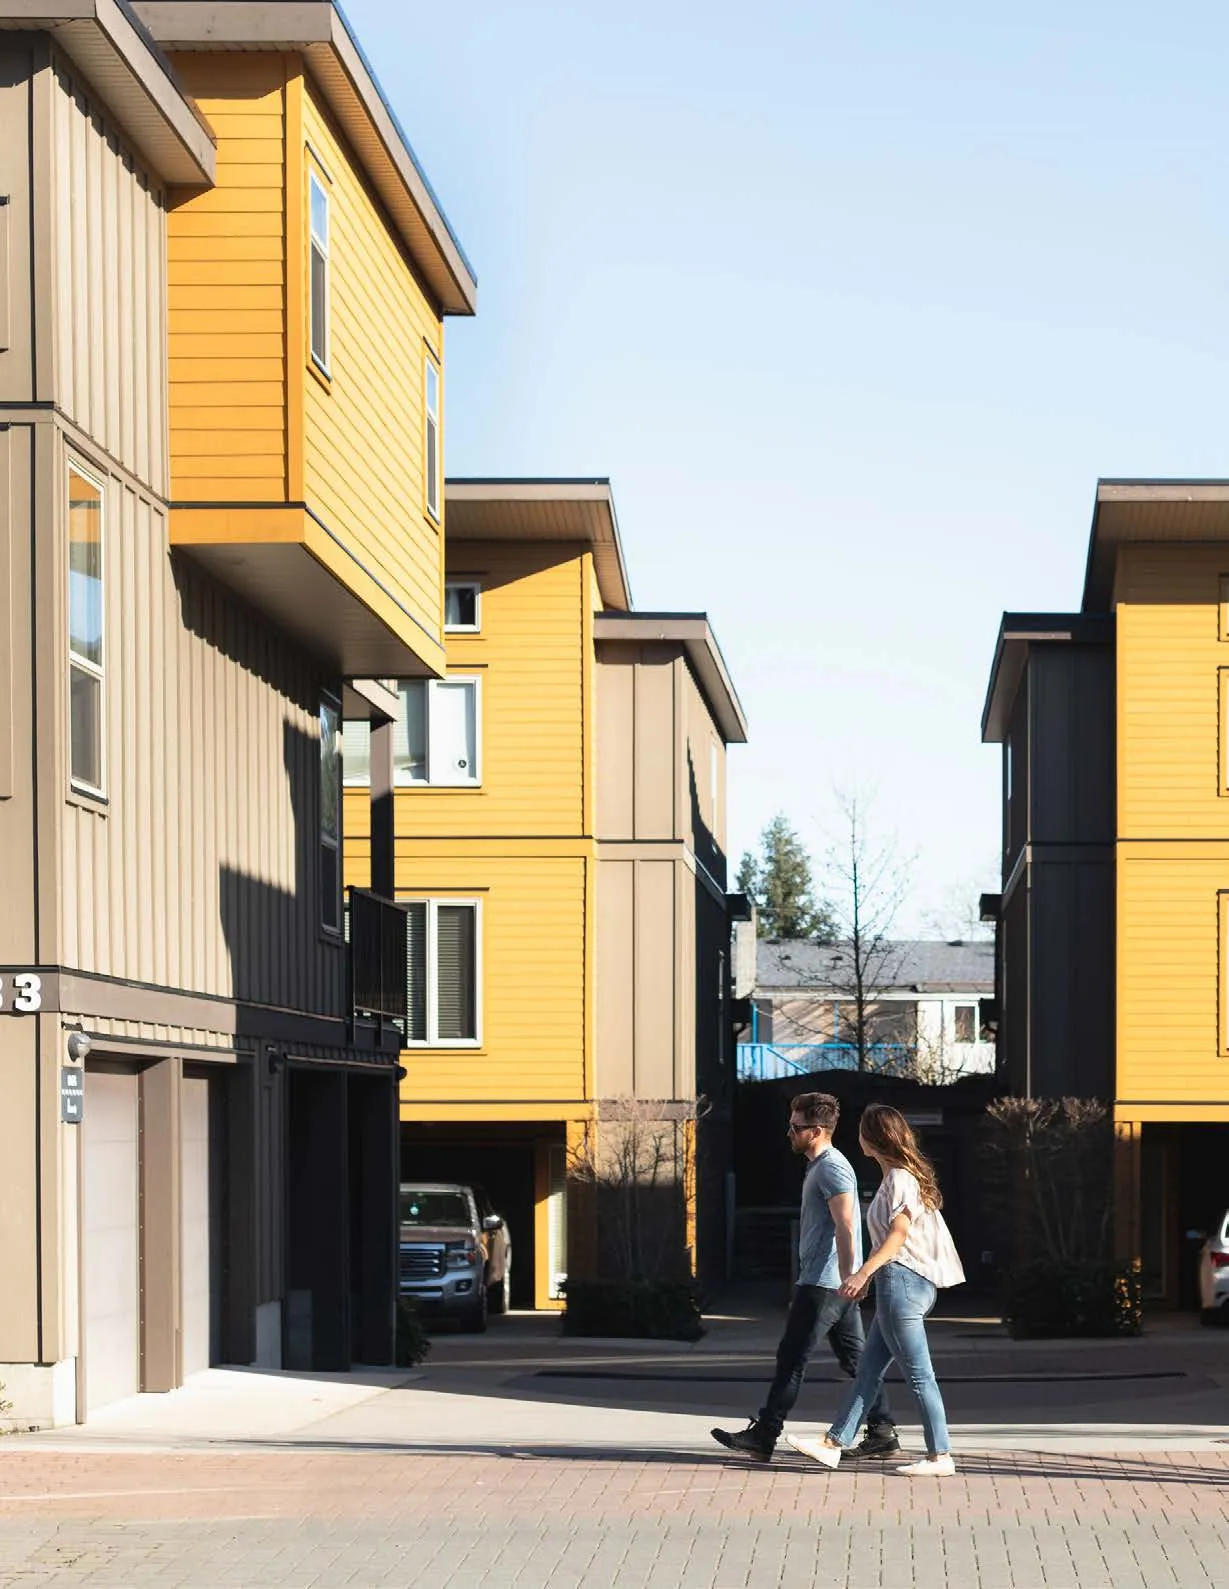
The RCMP provides police protection for Langford through the West Shore RCMP Detachment. The City’s portion of policing resources is funded through a police service contract with the Province of BC. West Shore RCMP serves Langford, Colwood, View Royal, Metchosin, Highlands, Songhees First Nation, and Esquimalt First Nation. The detachment building is jointly owned by Langford, Colwood, and View Royal.
For 2023, Langford had an authorized strength of 65 RCMP officers and provided 24 municipal employees. The proposed 2024 budget includes an additional three RCMP Officers and one additional municipal employee to maintain officer per capita levels.
Community Safety and Municipal Bylaw Enforcement (CSME)
CSME addresses community issues, enforces regulatory bylaws, assesses risks, conducts patrols, and works with agencies to provide a proactive service.
Key Stats From 2023 (CSME & Police)
- 4,845 NUMBER OF ENFORCEMENT FILES OPENED (CSME)
- 52 LANGFORD CRIME RATE vs 94 PROVINCIAL AVERAGE
- 42 LANGFORD CASE LOAD vs 72.5 PROVINCIAL AVERAGE
- 0.05 LANGFORD CRIMINAL CODE OFFENCES PER CAPITA vs 0.12 PROVINCIAL AVERAGE
- 932 NUMBER OF COMMUNITY SAFETY PATROLS
- 1,422 NUMBER OF PARKING WARNINGS ISSUED
- 201 NUMBER OF PARKING TICKETS ISSUED
Budget Overview (Police & CSME)
| 2023 Budget | 2024 | 2025 | 2026 | 2027 | 2028 | |
|---|---|---|---|---|---|---|
| Police | 13,917,932 | 15,095,666 | 15,957,805 | 16,884,450 | 17,821,514 | 18,758,532 |
| CSME | 1,474,175 | 1,935,268 | 1,968,012 | 2,085,372 | 2,149,018 | 2,198,610 |
| Total Police & CSME | 15,392,107 | 17,030,934 | 17,925,817 | 18,969,822 | 19,970,532 | 20,957,142 |
Key Service Functions and Budget Initiatives for 2024
- Receive and investigate public complaints of Bylaw violations
- Ensure regulatory Bylaw compliance
- Provide street parking management and enforcement
- Conduct vehicle, bicycle, and foot patrols of public spaces
- Assist the unhoused where appropriate and ensure high levels of public safety
Capital Budget
Proposed 2024–2028 Capital Budget (summary)
| Year | Building | Engineering & Public Works | Fire Rescue & Emergency Program | General Government | Parks, Recreation & Facilities | Police & CSME | Total |
|---|---|---|---|---|---|---|---|
| 2024 | - | 55,656,516 | 184,000 | 49,244,000 | 5,180,000 | 937,560 | 111,202,076 |
| 2025 | 110,000 | 1,890,000 | 89,000 | 5,650,000 | 4,715,000 | 96,000 | 12,550,000 |
| 2026 | - | 2,310,000 | 1,525,000 | 2,000,000 | 1,100,000 | 96,000 | 7,031,000 |
| 2027 | - | 1,375,000 | 610,000 | 2,000,000 | 1,150,000 | 96,000 | 5,231,000 |
| 2028 | - | 2,050,000 | 225,000 | - | 1,100,000 | 96,000 | 3,471,000 |
| Grand Total (2024-2028) | 110,000 | 63,281,516 | 2,633,000 | 58,894,000 | 13,245,000 | 1,421,560 | 139,485,076 |
(Note: above totals reflect the departmental totals shown in the plan. See detailed project tables below.)
2024 Capital Budget — Funding Sources and Projects (selected projects and funding)
The following table shows 2024 capital projects and funding sources (selected rows as listed in the plan):
| Project Code | Project | Developer Contributions | Canada/BC Infra. Grant | Gas Tax | Roads DCC | Storm Drainage DCC | Parks & Open Space DCC | Debt | General Operating Reserve | General Amenity Reserve | Equipment Replacement Reserve | Police Building Capital Reserve | Capital Works Reserve | Affordable Housing Reserve | Grand Total |
|---|---|---|---|---|---|---|---|---|---|---|---|---|---|---|---|
| PW01 | Engineering Vehicle Purchase | 294,550 | 1,073,000 | 294,550 | |||||||||||
| PW09 | Luxton - Quonset Hut | 25,000 | 25,000 | ||||||||||||
| PW10 | Atco Trailer | 125,000 | 125,000 | ||||||||||||
| CM01 | Centre Mountain Residential Rd LSA | 8,653,258 | 8,653,258 | ||||||||||||
| CM02 | Centre Mountain Business Park Rd LSA | 15,880,627 | 15,880,627 | ||||||||||||
| CM03 | Centre Mountain Water Service LSA | 14,317,595 | 14,317,595 | ||||||||||||
| OT14 | Trolley Upgrades – Largest Little Free Library | 35,000 | 35,000 | ||||||||||||
| SD42 | Latoria Culvert Improvements | 41,247 | 2,000 | 43,247 | |||||||||||
| SD46 | Langshire/Glenshire SSL Water System PRV | 895,000 | 895,000 | ||||||||||||
| SL09 | Traffic Signal Upgrades | 200,000 | 200,000 | ||||||||||||
| SL14 | Latoria at Klahanie Signal | 519,000 | 519,000 | ||||||||||||
| SR32 | Neighbourhood Improvements | 350,000 | 350,000 | ||||||||||||
| SR76 | Millstream Rd Roundabout | 61,000 | 61,000 | ||||||||||||
| SR77 | ENG - Multi Use lanes | 1,477,307 | 1,477,307 | ||||||||||||
| SR80 | Chidlow Connector (Luxton/Sooke) | 16,000 | 16,000 | ||||||||||||
| SR83 | Peatt Rd Hydro | 239,109 | 239,109 | ||||||||||||
| SR84 | West Shore Pkwy @ Amy Rd Roundabout Improvement Project | 658,337 | 658,337 | ||||||||||||
| SR85 | Paving City Parking Lots | 373,000 | 373,000 | ||||||||||||
| SR86 | BMP Ultimate Marble to Ecoasis | 5,139,977 | 5,139,977 | ||||||||||||
| SR90 | Irwin Rd Improvements | 2,011,528 | 1,412,410 | 3,423,938 | |||||||||||
| SR92 | Westwind Drive Retaining Wall Repair | 674,382 | 674,382 | ||||||||||||
| SR94 | Royal Roads University Onsite Gravel Parking | 50,000 | 50,000 | ||||||||||||
| SR95 | City Centre Crosswalk | 140,000 | 140,000 | ||||||||||||
| SW01 | Sidewalk Infill | 1,795,300 | 1,795,300 | ||||||||||||
| SW20 | Luxton Sidewalk | 269,889 | 269,889 | ||||||||||||
| Engineering & Public Works Total (selected) | 5,139,977 | 1,477,307 | 2,846,637 | 41,247 | 39,746,480 | 1,412,410 | 3,624,908 | 294,550 | 1,073,000 | 55,656,516 |
Fire Rescue & Emergency Program (selected):
| Project Code | Project | Amount |
|---|---|---|
| EP02 | Emergency Preparedness - Equipment | 30,000 |
| FE14 | Fire Vehicle Replacement | 30,000 |
| FE23 | Firehall #2 | 30,000 |
| FE45 | Hose Replacement | 14,000 |
| FE47 | Water Storage Tank | 80,000 |
| Total Fire Rescue | 184,000 |
General Government (selected):
| Project Code | Project | Funding & Notes |
|---|---|---|
| FA01 | Municipal (City Hall) Upgrades | 250,000 |
| FA05 | Wi‑Fi Community Internet | 23,000 |
| FA08 | Admin Property Purchase | 41,050,000 debt + 450,000 operating reserve = 41,500,000 |
| FA17 | Website Design | 45,000 |
| FA25 | Fibre Network | 100,000 |
| FA36 | Council Video Streaming Hardware | 24,000 |
| FA39 | Pure Storage Additional Capacity | 140,000 |
| FA41 | gTechna Software | 40,000 |
| FA42 | Bryn Maur Masons Building | 7,000,000 |
| FA06 | IT - Servers/Printers/Backup | 102,000 |
Parks, Recreation & Facilities (selected):
| Project Code | Project | Amount/Funding |
|---|---|---|
| PD03 | JLBP Clubhouse | 475,000 |
| PD16 | Langford Gravity Zone and Nature Trails | 50,000 |
| PD19 | Porcher Park | 550,000 |
| PD23 | Desmond Pond Park Improvements | 50,000 |
| PD31 | Cy Jenkins Boardwalk Replacement | 275,000 |
| PD32 | Stadium Staining | 400,000 |
| PD35 | Glen Lake Spray Park | 425,000 |
| PD37 | WSP Culvert Trail | 500,000 |
| PD38 | Station Ave Shade Sails | 100,000 |
| PD39 | Langford Lake Accessible Dock | 200,000 |
| PK01 | Parkland Acquisition | 1,000,000 |
| (more PK items listed in full table) | ||
| Parks Total (selected) | 5,180,000 |
Police & CSME (selected):
| Project Code | Project | Amount |
|---|---|---|
| BL02 | CSME - Vehicle Replacement | 100,000 |
| BL03 | CREST Radio Purchase | 20,000 |
| PS02 | Police Building Improvements/Replacements | 96,000 |
| PS03 | Police Station | 721,560 |
| Total Police & CSME | 937,560 |
(See full 2024 Capital Budget table in the plan for complete funding allocations by source and project.)
2025 Capital Budget (selected projects & funding)
| Project | Funding Sources (selected) | Grand Total |
|---|---|---|
| Building – BI01 Building Inspection Vehicle Purchase | ICBC - Capital Grants | 110,000 |
| Engineering & Public Works – PW01 Engineering Vehicle Purchase; PW09 Luxton - Quonset Hut; SL09 Traffic Signal Upgrades; SR32 Neighbourhood Improvements; SW01 Sidewalk Infill; SL17 Leigh @ Dunford (New Signal Lights) | ICBC Grants; Roads DCC; Parks & Open Space DCC; Equipment Replacement Reserve; General Amenity Reserve | 1,890,000 (Engineering subtotal) |
| Fire Rescue – FE14 Fire Vehicle Replacement; FE45 Hose Replacement; FE23 Firehall #2 | various | 89,000 |
| General Government – FA01 Municipal upgrades; FA08 Admin Property Purchase | Debt; General Amenity Reserve | 5,650,000 |
| Parks – PK01 Parkland Acquisition; PK18 Hiking Trails; PK26 Parks Vehicle Purchase; PK73 Veterans Park Expansion; PK07 Disability & Access Improvements | Parks & Open Space DCC; Equipment Replacement Reserve | 4,715,000 |
| Police – PS02 Police Building Improvements/Replacements | Police Building Capital Reserve | 96,000 |
| 2025 Total | 12,550,000 |
(See 2025 Capital Budget table for detailed funding split by source.)
2026 Capital Budget (selected projects & funding)
| Project | Grand Total |
|---|---|
| Engineering & Public Works projects (PW01, PW09, SL09, SR32, SW01) | 2,310,000 |
| Fire Rescue – FE14 Fire Vehicle Replacement; FE23 Firehall #2 | 1,525,000 |
| General Government – FA08 Admin Property Purchase | 2,000,000 |
| Parks – PK01 Parkland Acquisition | 1,100,000 |
| Police – PS02 Police Building Improvements/Replacements | 96,000 |
| 2026 Total | 7,031,000 |
(See 2026 Capital Budget table for funding source allocations.)
2027 Capital Budget (selected)
| Project | Grand Total |
|---|---|
| Engineering & Public Works | 1,375,000 |
| Fire Rescue | 610,000 |
| General Government | 2,000,000 |
| Parks | 1,150,000 |
| Police & CSME | 96,000 |
| 2027 Total | 5,231,000 |
2028 Capital Budget (selected)
| Project | Grand Total |
|---|---|
| Engineering & Public Works | 2,050,000 |
| Fire Rescue | 225,000 |
| Parks | 1,100,000 |
| Police & CSME | 96,000 |
| 2028 Total | 3,471,000 |
Reserves
Impact of 2024 Budget on Reserve Funds (subject to change)
Reserve Funds — 2024 (Impact)
| Reserve Funds | Beginning Balance | Additions | Expenditures | Transfers Internal | Interest Earned/charged | Ending Balance |
|---|---|---|---|---|---|---|
| Capital Works | $ 2,652,074 | 1,405,000 | (3,497,000) | 79,562 | 639,636 | |
| Affordable Housing | 4,483,590 | 350,000 | (989,000) | 134,508 | 3,979,098 | |
| Parks and Open Space | 3,254,793 | 250,000 | 0 | 97,644 | 3,602,437 | |
| Parkland Improvement | 3,250 | 0 | 0 | 98 | 3,348 | |
| General Amenity | 3,400,716 | 2,500,000 | (5,769,893) | 102,021 | 232,844 | |
| Equipment Replacement | 1,502,979 | 1,000,000 | (753,200) | 45,089 | 1,794,868 | |
| Sidewalk Capital | 46,781 | 10,000 | 0 | 1,403 | 58,184 | |
| Bear Mountain Firehall | 1,655,714 | 15,000 | 0 | 49,671 | 1,720,385 | |
| Police Capital | 48,023 | 100,000 | (96,000) | 1,441 | 53,464 | |
| Special Police | 696,086 | 0 | 0 | 20,883 | 716,969 | |
| Downtown Parking | 132,458 | 0 | 0 | 3,974 | 136,432 | |
| Total Reserve Funds Balances | 17,876,464 | 5,630,000 | (11,105,093) | 0 | 536,294 | 12,937,665 |
Development Cost Charges — 2024 (Impact)
| DCC | Beginning Balance | Additions | Expenditures | Transfers Internal | Interest Earned/charged | Ending Balance |
|---|---|---|---|---|---|---|
| Parks | 170,144 | 0 | 0 | 5,104 | 175,248 | |
| Storm Drainage | 408,591 | 225,000 | (41,247) | 12,258 | 604,602 | |
| Roads | 1,427,278 | 2,500,000 | (2,846,637) (1,000,000) | 42,818 | 123,459 | |
| Sewers | 0 | 0 | 0 | 0 | 0 | |
| Parkland and Open Space | 5,942,435 | 1,600,000 | (3,590,000) | 1,000,000 | 178,273 | 5,130,708 |
| Total DCC Balances | 7,948,448 | 4,325,000 | (6,477,884) | 0 | 238,453 | 6,034,017 |
Other Reserve Accounts — 2024 (Impact)
| Account | Beginning Balance | Additions | Expenditures | Transfers Internal | Interest Earned/charged | Ending Balance |
|---|---|---|---|---|---|---|
| Surplus | 4,000,000 | 500,000 | (3,407,771) | 120,000 | 1,212,229 | |
| Infrastructure Sustainability Reserve | 1,305,329 | 0 | 39,160 | 1,344,489 | ||
| Community Works (Gas Tax) | 2,576,362 | 1,346,600 | (1,992,307) | 77,291 | 2,007,946 | |
| Total Other Reserve Accounts Balances | 7,881,691 | 1,846,600 | (5,400,078) | 0 | 236,451 | 4,564,664 |
Total Funds on Hand (2024 Impact): $33,706,603 beginning; Additions 11,801,600; Expenditures (22,983,055); Interest 1,011,198; Ending Balance $23,536,346.
Impact of 2025 Budget on Reserve Funds
Reserve Funds — 2025 (Impact)
| Reserve Funds | Beginning Balance | Additions | Expenditures | Transfers Internal | Interest Earned/charged | Ending Balance |
|---|---|---|---|---|---|---|
| Capital Works | $639,636 | 1,405,000 | (1,600,000) | 19,189 | 463,825 | |
| Affordable Housing | 3,979,098 | 350,000 | (347,290) | 119,373 | 4,101,181 | |
| Parks and Open Space | 3,602,437 | 250,000 | 0 | 108,073 | 3,960,510 | |
| Parkland Improvement | 3,348 | 0 | 0 | 100 | 3,448 | |
| General Amenity | 232,844 | 2,500,000 | (2,686,985) | 6,985 | 52,845 | |
| Equipment Replacement | 1,794,868 | 1,000,000 | (435,200) | 53,846 | 2,413,514 | |
| Sidewalk Capital | 58,184 | 10,000 | 0 | 1,746 | 69,930 | |
| Bear Mountain Firehall | 1,720,385 | 15,000 | 0 | 51,612 | 1,786,997 | |
| Police Capital | 53,464 | 100,000 | (96,000) | 1,604 | 59,068 | |
| Special Police | 716,969 | 0 | 0 | 21,509 | 738,478 | |
| Downtown Parking | 136,432 | 0 | 0 | 4,093 | 140,525 | |
| Total Reserve Funds Balances | 12,937,665 | 5,630,000 | (5,165,475) | 0 | 388,130 | 13,790,320 |
Development Cost Charges — 2025 (Impact)
| DCC | Beginning Balance | Additions | Expenditures | Transfers Internal | Interest Earned/charged | Ending Balance |
|---|---|---|---|---|---|---|
| Parks | 175,248 | 0 | 0 | 5,257 | 180,506 | |
| Storm Drainage | 604,602 | 225,000 | 0 | 18,138 | 847,740 | |
| Roads | 123,459 | 2,250,000 | (225,000) (2,000,000) | 3,704 | 152,163 | |
| Parkland and Open Space | 5,130,708 | 1,600,000 | (4,625,000) | 2,000,000 | 153,921 | 5,130,708 |
| Total DCC Balances | 6,034,017 | 4,075,000 | (4,850,000) | 0 | 181,021 | 5,440,038 |
Other Reserve Accounts — 2025 (Impact)
| Account | Beginning Balance | Additions | Expenditures | Interest | Ending Balance |
|---|---|---|---|---|---|
| Surplus | 1,212,229 | 500,000 | (285,000) | 36,367 | 1,463,596 |
| Infrastructure Sustainability Reserve | 1,344,489 | 0 | 40,335 | 1,384,824 | |
| Community Works (Gas Tax) | 2,007,946 | 1,373,532 | (120,000) | 60,238 | 3,321,716 |
| Total Other Reserve Accounts Balances | 4,564,664 | 1,873,532 | (405,000) | 0 | 136,940 |
Total Funds on Hand (2025 Impact): $23,536,346 beginning; Additions 11,578,532; Expenditures (10,420,475); Interest 706,090; Ending Balance $25,400,493.
Impact of 2026 Budget on Reserve Funds
Reserve Funds — 2026 (Impact)
| Reserve Funds | Beginning Balance | Additions | Expenditures | Transfers Internal | Interest Earned/charged | Ending Balance |
|---|---|---|---|---|---|---|
| Capital Works | $463,825 | 1,405,000 | (1,350,000) | 13,915 | 532,740 | |
| Affordable Housing | 4,101,181 | 300,000 | (270,695) | 123,035 | 4,253,521 | |
| Parks and Open Space | 3,960,510 | 250,000 | 0 | 118,815 | 4,329,325 | |
| Parkland Improvement | 3,448 | 0 | 0 | 103 | 3,551 | |
| General Amenity | 52,845 | 2,250,000 | (2,050,000) | 1,585 | 254,430 | |
| Equipment Replacement | 2,413,514 | 1,000,000 | (1,818,700) | 72,405 | 1,667,220 | |
| Sidewalk Capital | 69,930 | 10,000 | 0 | 2,098 | 82,028 | |
| Bear Mountain Firehall | 1,786,997 | 10,000 | 0 | 53,610 | 1,850,607 | |
| Police Capital | 59,068 | 100,000 | (96,000) | 1,772 | 64,840 | |
| Special Police | 738,478 | 0 | 0 | 22,154 | 760,632 | |
| Downtown Parking | 140,525 | 0 | 0 | 4,216 | 144,740 | |
| Total Reserve Funds Balances | 13,790,320 | 5,325,000 | (5,585,395) | 0 | 413,710 | 13,943,634 |
Development Cost Charges — 2026 (Impact)
| DCC | Beginning Balance | Additions | Expenditures | Transfers Internal | Interest Earned/charged | Ending Balance |
|---|---|---|---|---|---|---|
| Parks | 180,506 | 0 | 0 | 5,415 | 185,921 | |
| Storm Drainage | 847,740 | 225,000 | 0 | 25,432 | 847,740 | |
| Roads | 152,163 | 2,000,000 | 0 (2,000,000) | 4,565 | 156,728 | |
| Parkland & Open Space | 4,259,629 | 1,600,000 | (1,100,000) | 2,000,000 | 127,789 | 6,887,418 |
| Total DCC Balances | 5,440,038 | 3,825,000 | (1,100,000) | 0 | 163,201 | 8,328,239 |
Other Reserve Accounts — 2026 (Impact)
| Account | Beginning Balance | Additions | Expenditures | Interest | Ending Balance |
|---|---|---|---|---|---|
| Surplus | 1,463,596 | 500,000 | (285,000) | 43,908 | 1,722,504 |
| Infrastructure Sustainability Reserve | 1,384,824 | 0 | 41,545 | 1,426,368 | |
| Community Works (Gas Tax) | 3,321,716 | 1,401,003 | (120,000) | 99,651 | 4,702,370 |
| Total Other Reserve Accounts Balances | 6,170,136 | 1,901,003 | (405,000) | 0 | 185,104 |
Total Funds on Hand (2026 Impact): $25,400,493 beginning; Additions 11,051,003; Expenditures (7,090,395); Interest 762,015; Ending Balance $30,123,116.
Impact of 2027 Budget on Reserve Funds
Reserve Funds — 2027 (Impact)
| Reserve Funds | Beginning Balance | Additions | Expenditures | Transfers Internal | Interest Earned/charged | Ending Balance |
|---|---|---|---|---|---|---|
| Capital Works | $532,740 | 1,405,000 | (1,350,000) | 15,982 | 603,722 | |
| Affordable Housing | 4,253,521 | 300,000 | (273,716) | 127,606 | 4,407,411 | |
| Parks and Open Space | 3,960,510 | 250,000 | 0 | 118,815 | 4,329,325 | |
| Parkland Improvement | 3,551 | 0 | 0 | 103 | 3,658 | |
| General Amenity | 254,430 | 2,000,000 | (1,800,000) | 7,633 | 462,063 | |
| Equipment Replacement | 1,667,220 | 1,000,000 | (741,200) | 50,017 | 1,976,036 | |
| Sidewalk Capital | 69,930 | 10,000 | 0 | 2,461 | 82,028 | |
| Bear Mountain Firehall | 1,786,997 | 10,000 | 0 | 53,610 | 1,850,607 | |
| Police Capital | 59,068 | 100,000 | (96,000) | 1,772 | 64,840 | |
| Special Police | 738,478 | 0 | 0 | 22,154 | 760,632 | |
| Downtown Parking | 140,525 | 0 | 0 | 4,216 | 144,740 | |
| Total Reserve Funds Balances | 13,943,634 | 5,325,000 | (5,585,395) | 0 | 413,710 | 13,943,634 |
Development Cost Charges — 2027 (Impact)
| DCC | Beginning Balance | Additions | Expenditures | Transfers Internal | Interest Earned/charged | Ending Balance |
|---|---|---|---|---|---|---|
| Parks | 185,921 | 0 | 0 | 5,578 | 191,499 | |
| Storm Drainage | 1,098,172 | 225,000 | 0 | 32,945 | 1,356,117 | |
| Roads | 156,728 | 2,000,000 | 0 (1,000,000) | 4,702 | 1,161,430 | |
| Parkland & Open Space | 6,887,418 | 1,600,000 | (1,100,000) | 1,000,000 | 206,623 | 8,594,041 |
| Total DCC Balances | 8,328,239 | 3,825,000 | (1,100,000) | 0 | 249,847 | 11,303,086 |
Other Reserve Accounts — 2027 (Impact)
| Account | Beginning Balance | Additions | Expenditures | Interest | Ending Balance |
|---|---|---|---|---|---|
| Surplus | 1,722,504 | 500,000 | (285,000) | 51,675 | 1,989,179 |
| Infrastructure Sustainability Reserve | 1,426,368 | 0 | 42,791 | 1,469,159 | |
| Community Works (Gas Tax) | 4,702,370 | 1,429,023 | (120,000) | 141,071 | 6,152,464 |
| Total Other Reserve Accounts Balances | 7,851,242 | 1,929,023 | (405,000) | 0 | 235,537 |
Total Funds on Hand (2027 Impact): $30,123,116 beginning; Additions 10,779,023; Expenditures (5,765,916); Interest 903,693; Ending Balance $36,039,916.
Impact of 2028 Budget on Reserve Funds
Reserve Funds — 2028 (Impact)
| Reserve Funds | Beginning Balance | Additions | Expenditures | Transfers Internal | Interest Earned/charged | Ending Balance |
|---|---|---|---|---|---|---|
| Capital Works | $603,722 | 1,405,000 | (1,325,000) | 18,112 | 701,834 | |
| Affordable Housing | 4,407,411 | 300,000 | (273,716) | 127,606 | 4,562,806 | |
| Parks and Open Space | 4,329,325 | 200,000 | 0 | 129,880 | 4,659,205 | |
| Parkland Improvement | 3,551 | 0 | 0 | 107 | 3,658 | |
| General Amenity | 254,430 | 2,000,000 | (1,800,000) | 7,633 | 462,063 | |
| Equipment Replacement | 1,667,220 | 1,000,000 | (741,200) | 50,017 | 1,976,036 | |
| Sidewalk Capital | 69,930 | 10,000 | 0 | 2,461 | 82,028 | |
| Bear Mountain Firehall | 1,786,997 | 10,000 | 0 | 53,610 | 1,850,607 | |
| Police Capital | 59,068 | 100,000 | (96,000) | 1,772 | 64,840 | |
| Special Police | 738,478 | 0 | 0 | 22,154 | 760,632 | |
| Downtown Parking | 140,525 | 0 | 0 | 4,216 | 144,740 | |
| Total Reserve Funds Balances | 13,943,634 | 5,025,000 | (4,260,916) | 0 | 418,309 | 15,126,027 |
Development Cost Charges — 2028 (Impact)
| DCC | Beginning Balance | Additions | Expenditures | Transfers Internal | Interest Earned/charged | Ending Balance |
|---|---|---|---|---|---|---|
| Parks | 191,499 | 0 | 0 | 5,745 | 197,244 | |
| Storm Drainage | 1,356,117 | 225,000 | (1,500,000) | 40,684 | 121,801 | |
| Roads | 1,161,430 | 2,000,000 | 0 | 34,843 | 3,196,273 | |
| Parkland & Open Space | 8,594,041 | 1,600,000 | (1,100,000) | 257,821 | 9,351,862 | |
| Total DCC Balances | 11,303,086 | 3,825,000 | (2,600,000) | 0 | 339,093 | 12,867,179 |
Other Reserve Accounts — 2028 (Impact)
| Account | Beginning Balance | Additions | Expenditures | Interest | Ending Balance |
|---|---|---|---|---|---|
| Surplus | 1,989,179 | 500,000 | (285,000) | 59,675 | 2,263,854 |
| Infrastructure Sustainability Reserve | 1,469,159 | 0 | 44,075 | 1,513,234 | |
| Community Works (Gas Tax) | 6,152,464 | 1,457,603 | (120,000) | 184,574 | 7,674,641 |
| Total Other Reserve Accounts Balances | 9,610,802 | 1,957,603 | (405,000) | 0 | 288,324 |
Total Funds on Hand (2028 Impact): $36,039,916 beginning; Additions 10,807,603; Expenditures (5,657,727); Interest 1,081,197; Ending Balance $42,270,990.
(End of extracted pages 15–55 content)